Clinical Research Services

Methodology examples and analytical approaches

Methodological approaches organised by study design. Each study-type page provides a complete analytical framework, strategies for addressing common reviewer questions, and a deliverables list.

Illustrative study types · 10 methodological figures · No actual client projects represented

Core study designs
4 types
Methodological illustrations
10 figures
Reporting checklists
4 sets
Actual patient data
0 cases

01 Clinical Research

Study designs

Browse analytical frameworks, methodological risks and deliverables by study design.

Illustrative data. All figures and numbers on this page are Illustrative data (synthetic), generated by Yanto Health using R simulation scripts. They do not represent any actual patients, hospitals or client projects. Generation scripts are available on request.

Methodological approaches and common reviewer queries for four study designs

Methodological approaches and common reviewer queries for four common study designs. All figures use Illustrative data to show how results can be presented.

Cohort study · Cohort
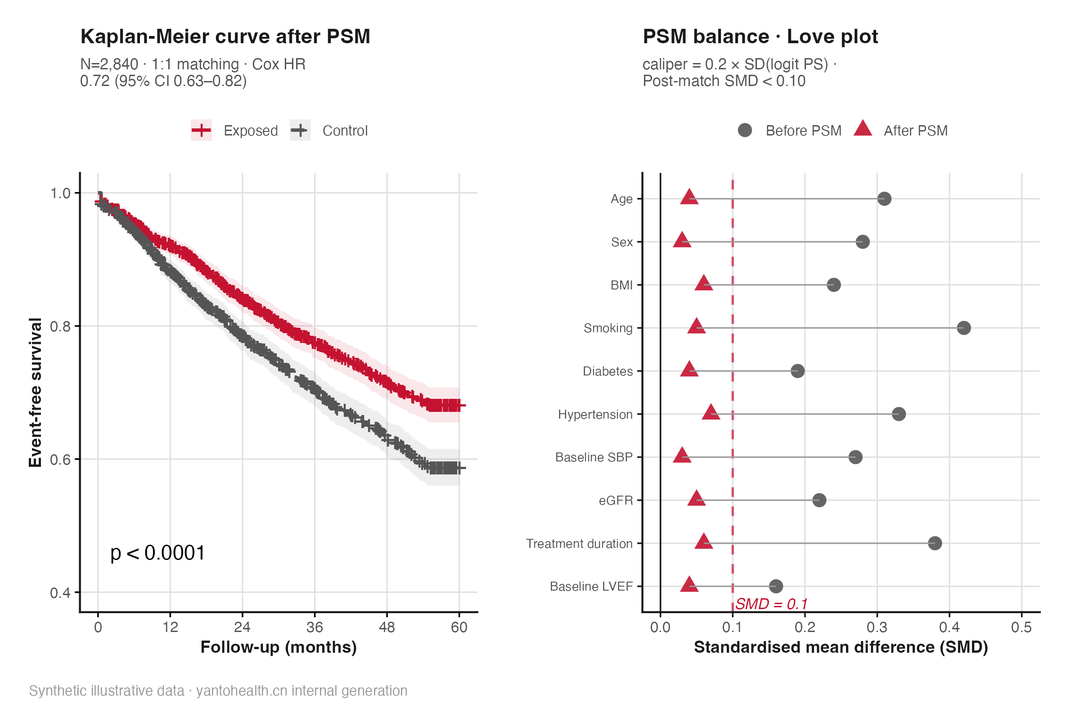
Illustrative Kaplan-Meier curves and Love plot: event-free survival curves for two propensity-score-matched groups on the left; standardised mean differences for each covariate before and after matching on the right.

Multicentre retrospective cohort · Exposure and clinical endpoints

Propensity score matching (PSM) + multivariable Cox model, with IPTW for sensitivity analysis.

Figure 1 · Illustrative data · Synthetic illustrative data Illustrative Kaplan-Meier curves and Love plot using the same Illustrative data as /case-cohort/.

View methodology details
Systematic review and meta-analysis · Meta
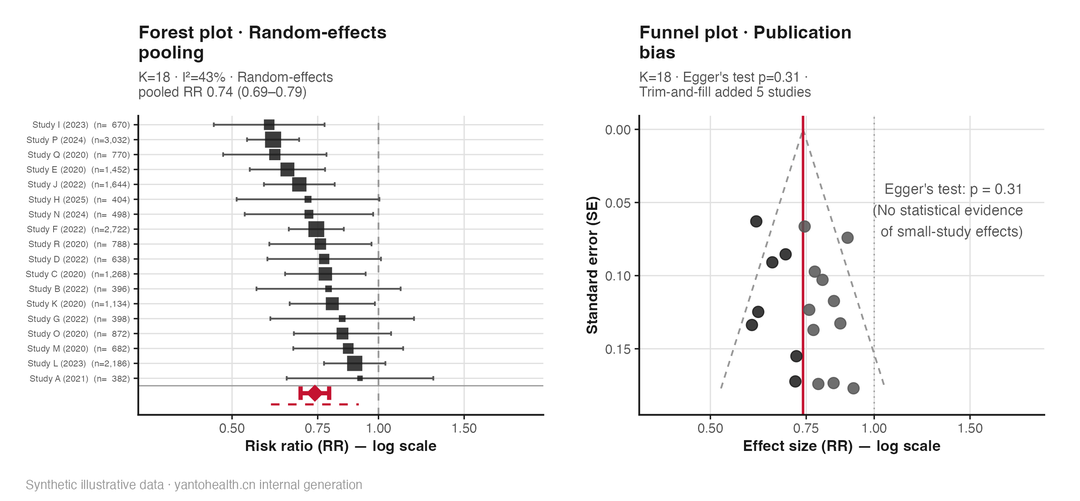
Illustrative forest and funnel plots: one effect estimate and confidence interval per study, with the pooled effect and symmetry check below.

An intervention and clinical endpoints · Systematic review and meta-analysis

PRISMA 2020 flow + heterogeneity I² and Egger's test + indirect comparisons through network meta-analysis.

Figure 2 · Illustrative data · Synthetic illustrative data Illustrative forest and funnel plots using the same Illustrative data as /case-meta/.

View methodology details
Diagnostic and prediction models · Diagnostic
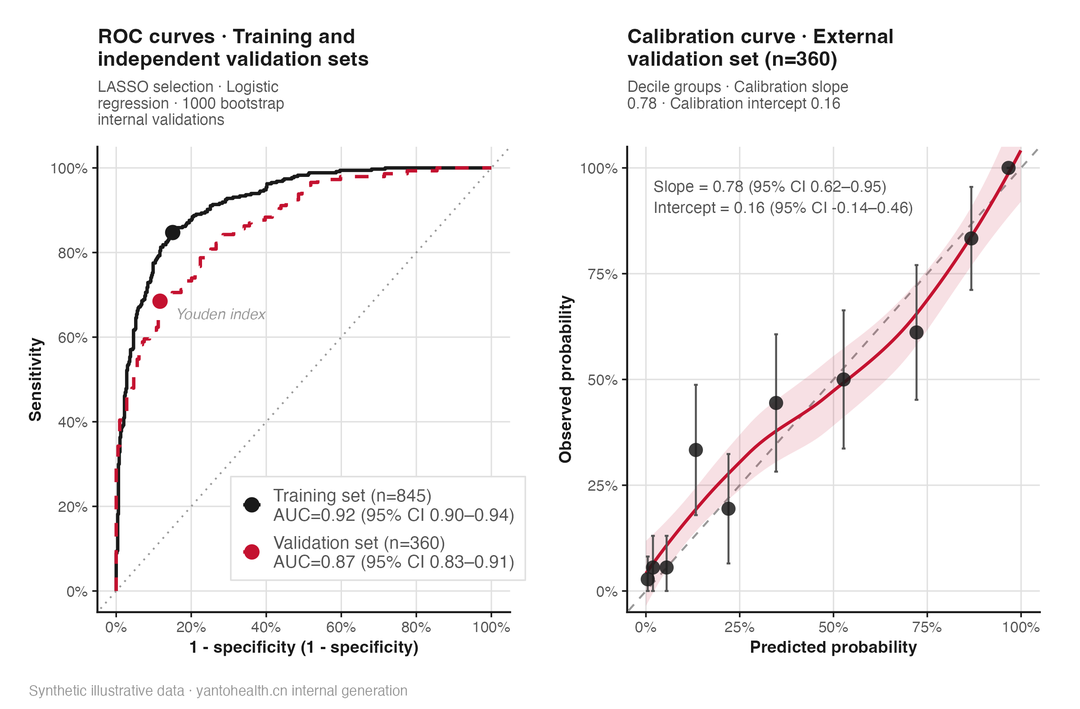
Illustrative ROC and calibration curves: two model curves compared on sensitivity–specificity axes, alongside calibration of predicted probabilities against observed rates.

Radiomics diagnostic model · Distinguishing benign and malignant lesions

ROC discrimination + calibration curves + decision curve analysis (DCA, assessing clinical utility) + bootstrap internal validation.

Figure 3 · Illustrative data · Synthetic illustrative data Illustrative ROC and calibration curves using the same Illustrative data as /case-diagnostic/.

View methodology details
Real-world research · RWD
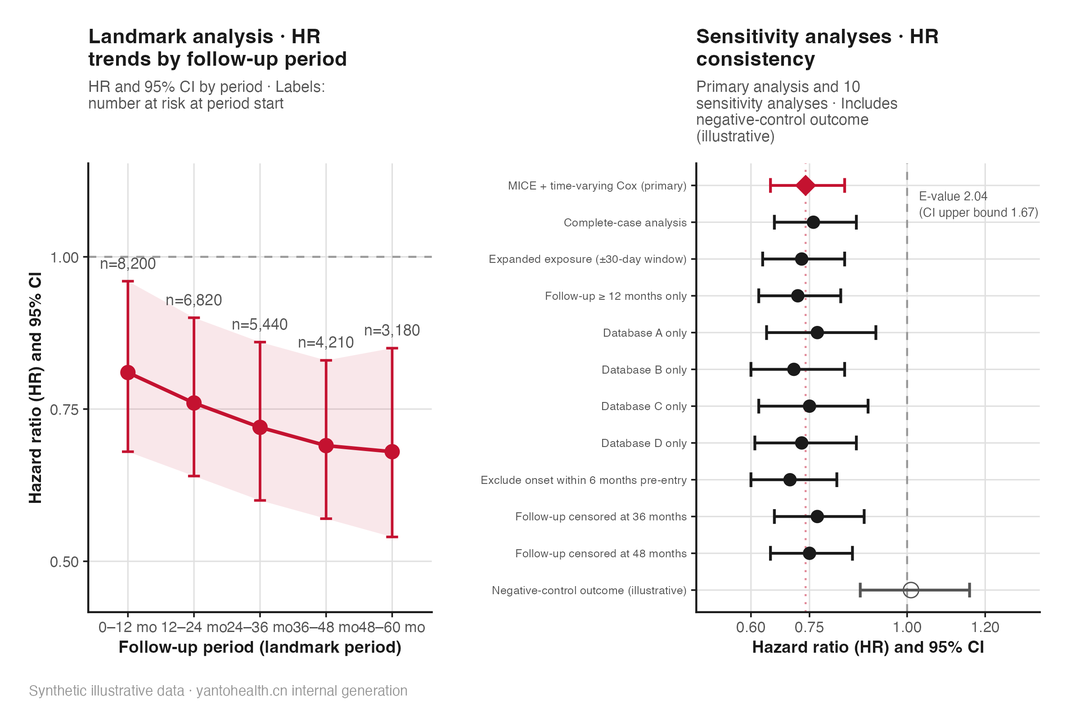
Illustrative landmark-stratified hazard ratio trends and a sensitivity analysis summary forest plot: hazard ratios over follow-up intervals on the left, and effect estimates from the main and sensitivity analyses on the right.

Longitudinal follow-up data · Comparing trajectories across treatment groups

Multiple imputation + time-stratified Cox + time-varying covariates to address immortal time bias.

Figure 4 · Illustrative data · Synthetic illustrative data Illustrative landmark-stratified hazard ratios and sensitivity analysis summary using the same Illustrative data as /case-rws/.

View methodology details

Illustrations are generated by the same R script (seed 20260519), with values matching the corresponding example pages.

Retrospective cohort study

Illustrative data

Illustrative data from a multicentre retrospective cohort · N=2,840 · 60-month follow-up window. Core methods: propensity score matching (PSM) + Cox proportional hazards models + inverse probability of treatment weighting (IPTW) sensitivity analysis. Focus: preventing immortal time bias, directed acyclic graph (DAG)-guided confounding adjustment, competing risks and E-value reporting.

Systematic review and meta-analysis

Illustrative data

Illustrative data · K=18 randomised controlled trials (RCTs) · I²=43% · Includes indirect comparisons using network meta-analysis. Core methods: Preferred Reporting Items for Systematic Reviews and Meta-Analyses (PRISMA) 2020 + four-database search + Risk of Bias (RoB) 2.0 assessment + meta-regression for heterogeneity + Egger / Trim-fill publication bias assessment + Grading of Recommendations Assessment, Development and Evaluation (GRADE) evidence quality assessment.

Radiomics diagnostic model

Illustrative data

Illustrative data · Training set 845 + external validation set 360 · External validation area under the curve (AUC)=0.87 · Least absolute shrinkage and selection operator (LASSO) + 1000 bootstrap resamples. Core methods: intraclass correlation coefficient (ICC) feature stability screening + strict training/validation separation to prevent data leakage + LASSO regularisation for dimensionality reduction + decision curve analysis (DCA) + item-by-item Transparent Reporting of a multivariable prediction model for Individual Prognosis Or Diagnosis, including Artificial Intelligence (TRIPOD+AI) checks.

Real-world data study

Illustrative data

Illustrative data · 8,200 initially at risk · 4 health insurance databases · Cox model with time-varying covariates. Core methods: standardised International Classification of Diseases (ICD) code mapping + precise timeline alignment to prevent immortal time bias + multiple imputation by chained equations (MICE) + time-varying Cox + negative control outcome sensitivity analysis.

02 Clinical Research

Methods and study designs

✓ indicates commonly used methods listed in the source; suitability depends on the specific research question.

Four study designs and their commonly used analytical methods
Analytical methodCohortMeta METADiagnostic modelReal-world data (RWD)
DAG causal diagram✓ Core——✓ Core
PSM / IPTW propensity scores✓ Primary analysis——✓ Sensitivity
Cox / time-varying Cox✓ Primary model——✓ Time-varying format
LASSO / bootstrap validation— Optional—✓ Core—
MICE multiple imputation✓ Routine—✓ Within training set✓ Extensive missingness
GRADE / RoB assessment—✓ Core— TRIPOD+AI—
DCA decision curves——✓ Clinical value—
Competing risks models✓ As appropriate——✓ Routine

03 Clinical Research

Common reviewer questions

The following are illustrative methodological formulations organised by reporting guideline items. They do not reproduce actual reviewer comments or represent any particular journal or reviewer.

Immortal time and competing risks

Immortal time bias from exposure starting after follow-up; failure to report standardised mean differences (SMDs) after PSM; unaddressed competing events; and untruncated IPTW weights. See the relevant example page for full preventive strategies.

Heterogeneity and search completeness

High I² without meta-regression to explore its sources; searching only 2 databases; single-reviewer screening without Kappa reporting; unclear GRADE downgrading; and funnel plot asymmetry without small-study effect assessment and sensitivity analyses.

Data leakage and external validation

Data leakage from feature selection before data splitting (inflated training AUC); no independent external validation set; reporting AUC without DCA; and no ICC assessment of feature stability.

ICD mapping and time-varying confounding

Mixed ICD-9/10 versions without a mapping strategy; unaddressed immortal time bias; using only baseline values for time-varying covariates; no assessment of between-cohort consistency before pooling databases; and no negative control outcome analysis.

Get started · Methodology assessment

Book a methodology assessment

Submit your research question, available data and intended outputs. Reply within 24 hours (business days first), with feasibility feedback, viable statistical approaches and a recommended package in our first response.

Request an assessmentFree assessment · Quote after assessment