
Clinical Research Services
Systematic review and meta-analysis
The central challenge in meta-analysis is whether pooling is justified, rather than technical difficulty. Without prespecified strategies, high I², positive Egger tests and downgrading under Grading of Recommendations Assessment, Development and Evaluation (GRADE) can attract repeated questions across review rounds.
All data and figures on this page are Illustrative data and do not represent actual patients, hospitals or client projects.
- Included RCTs
- K=18
- Moderate heterogeneity
- I²=43%
- Random-effects pooled estimate
- RR=0.74
- Includes network meta-analysis indirect comparisons
- Network
01 Clinical Research
Methodological figures
Illustrative data show analytical approaches and presentation only; they do not represent actual project results.
Illustrative data. All figures and numbers on this page are Illustrative data (synthetic), generated by Yanto Health using R simulation scripts. They do not represent any actual patients, hospitals or client projects. Generation scripts are available on request.
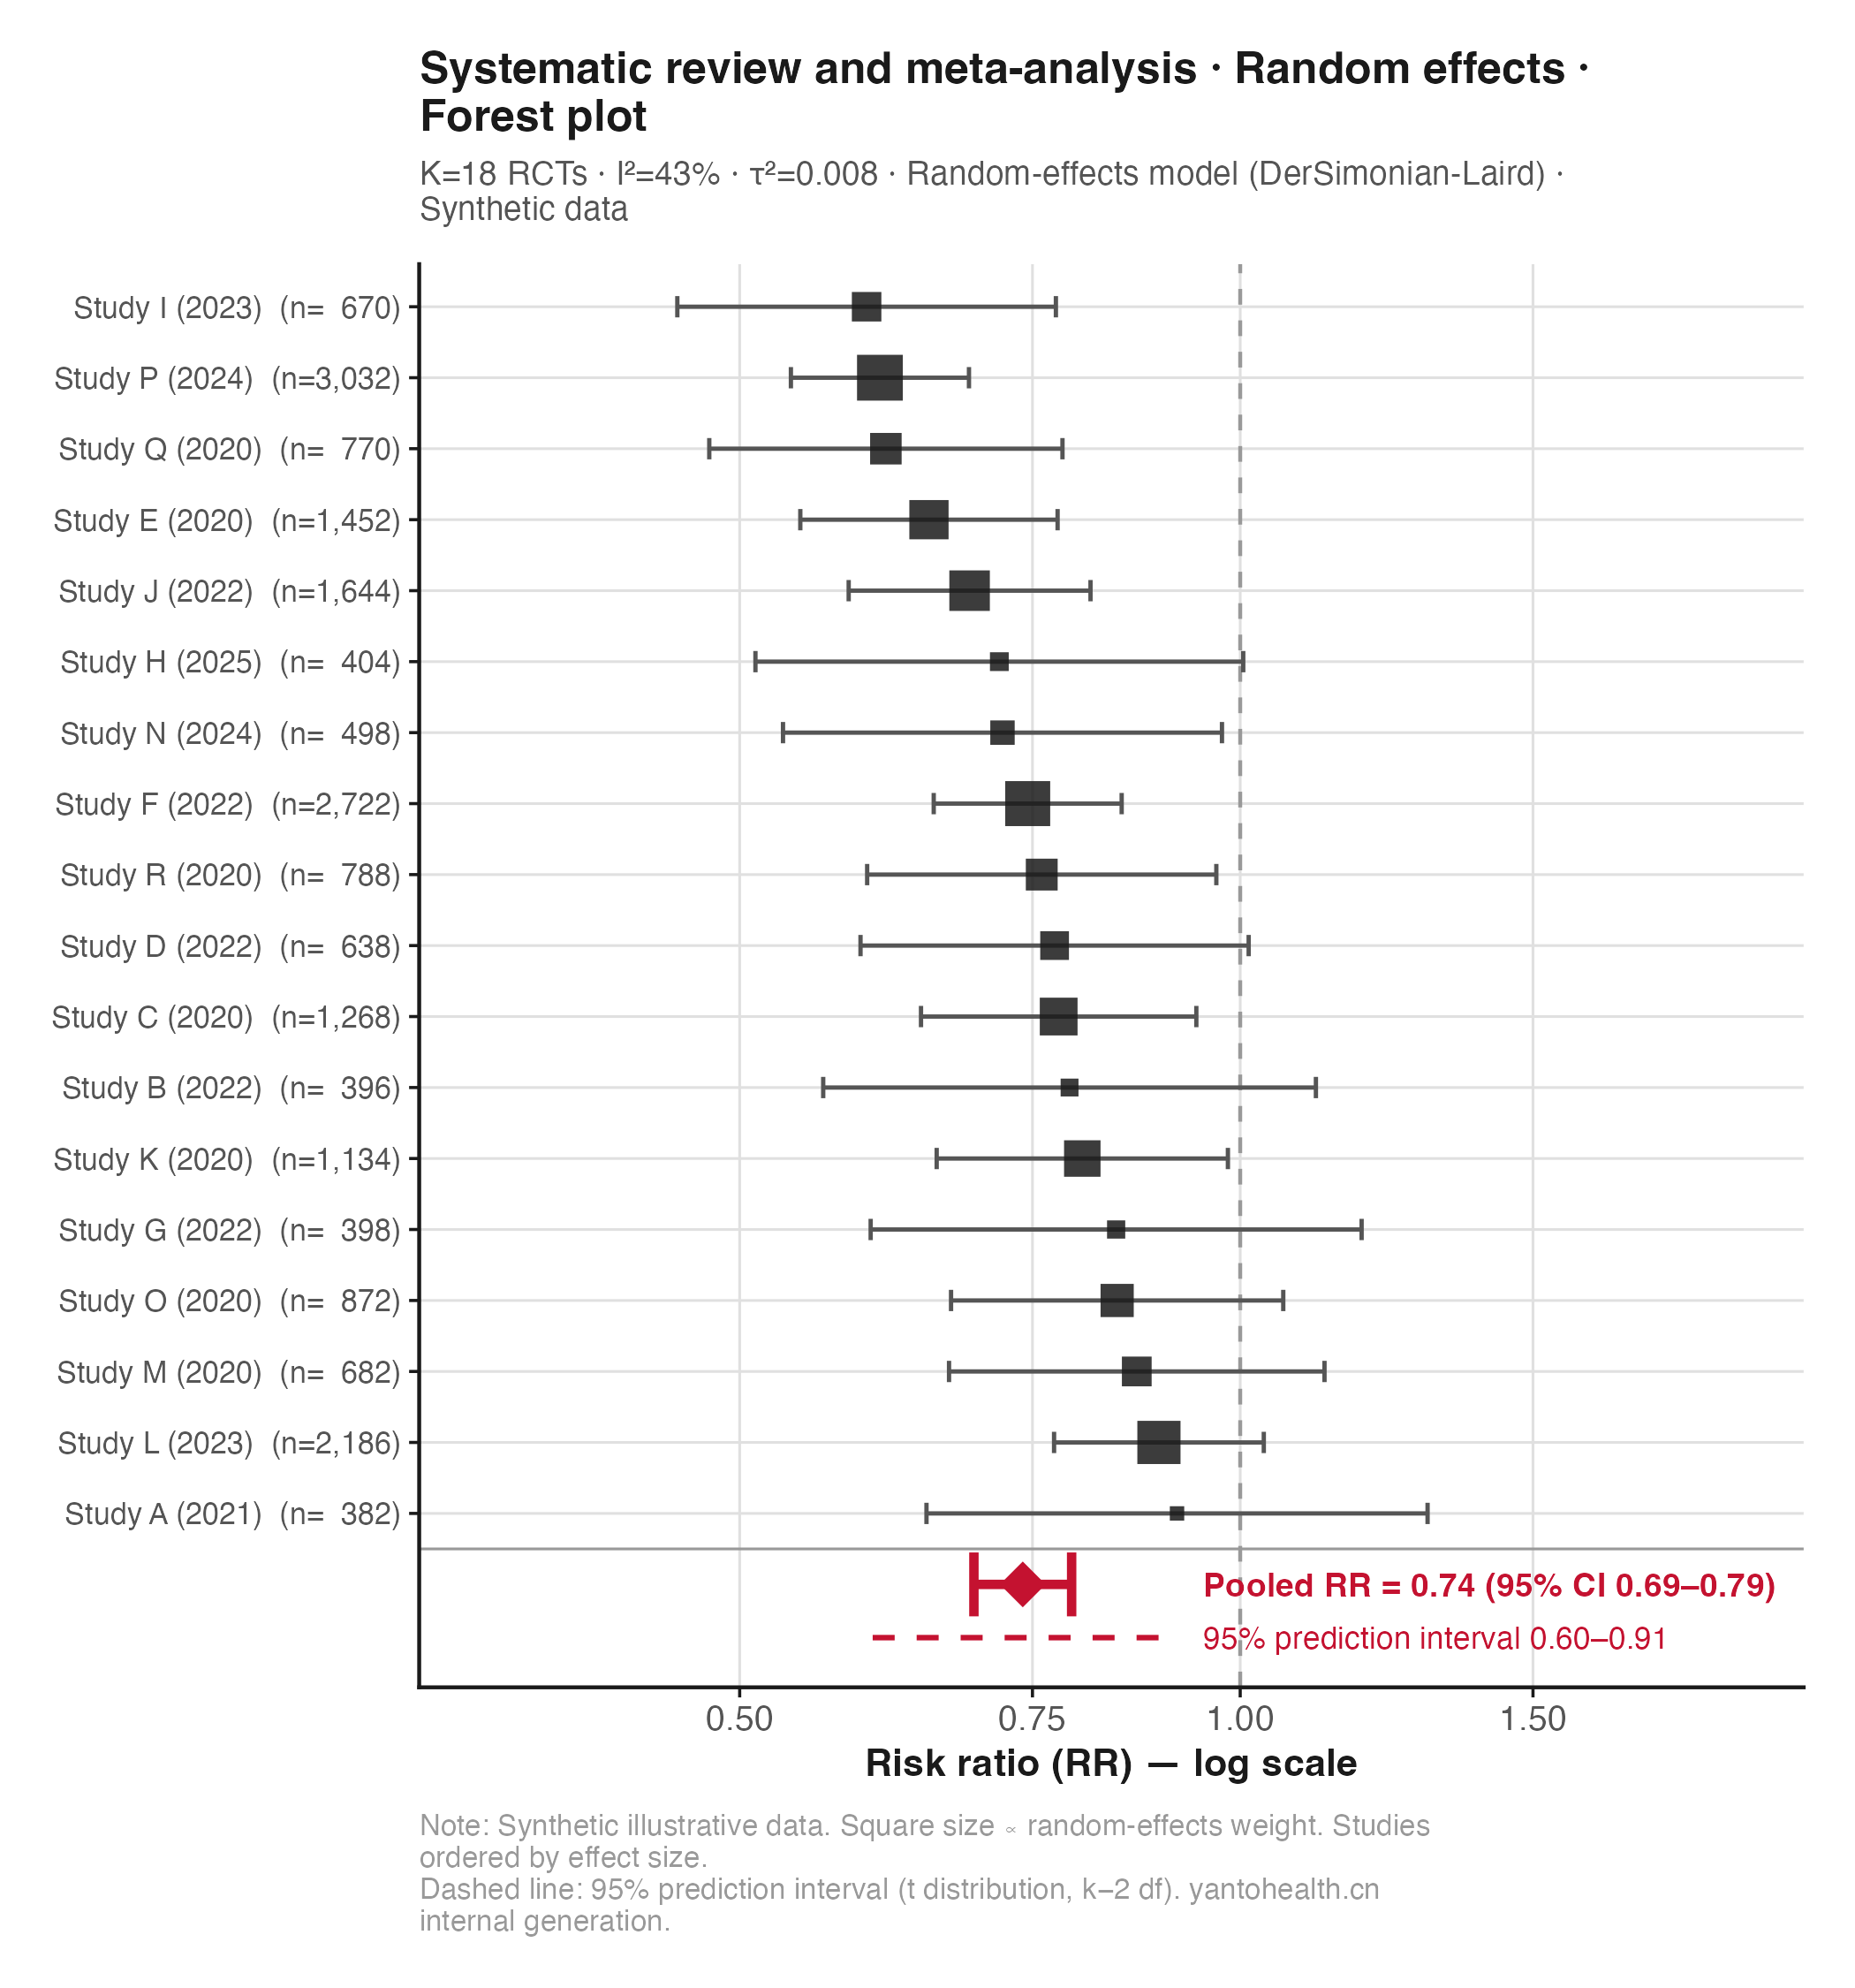
Caption and interpretation limits
K=18 RCTs, I²=43% (moderate heterogeneity), τ²=0.008; DerSimonian-Laird random-effects pooled RR=0.74 (95% CI 0.69–0.79), with a 95% prediction interval of 0.60–0.91. Studies are ordered by effect size; square areas are proportional to random-effects weights. The red diamond is the pooled effect and the red dashed line is the prediction interval.
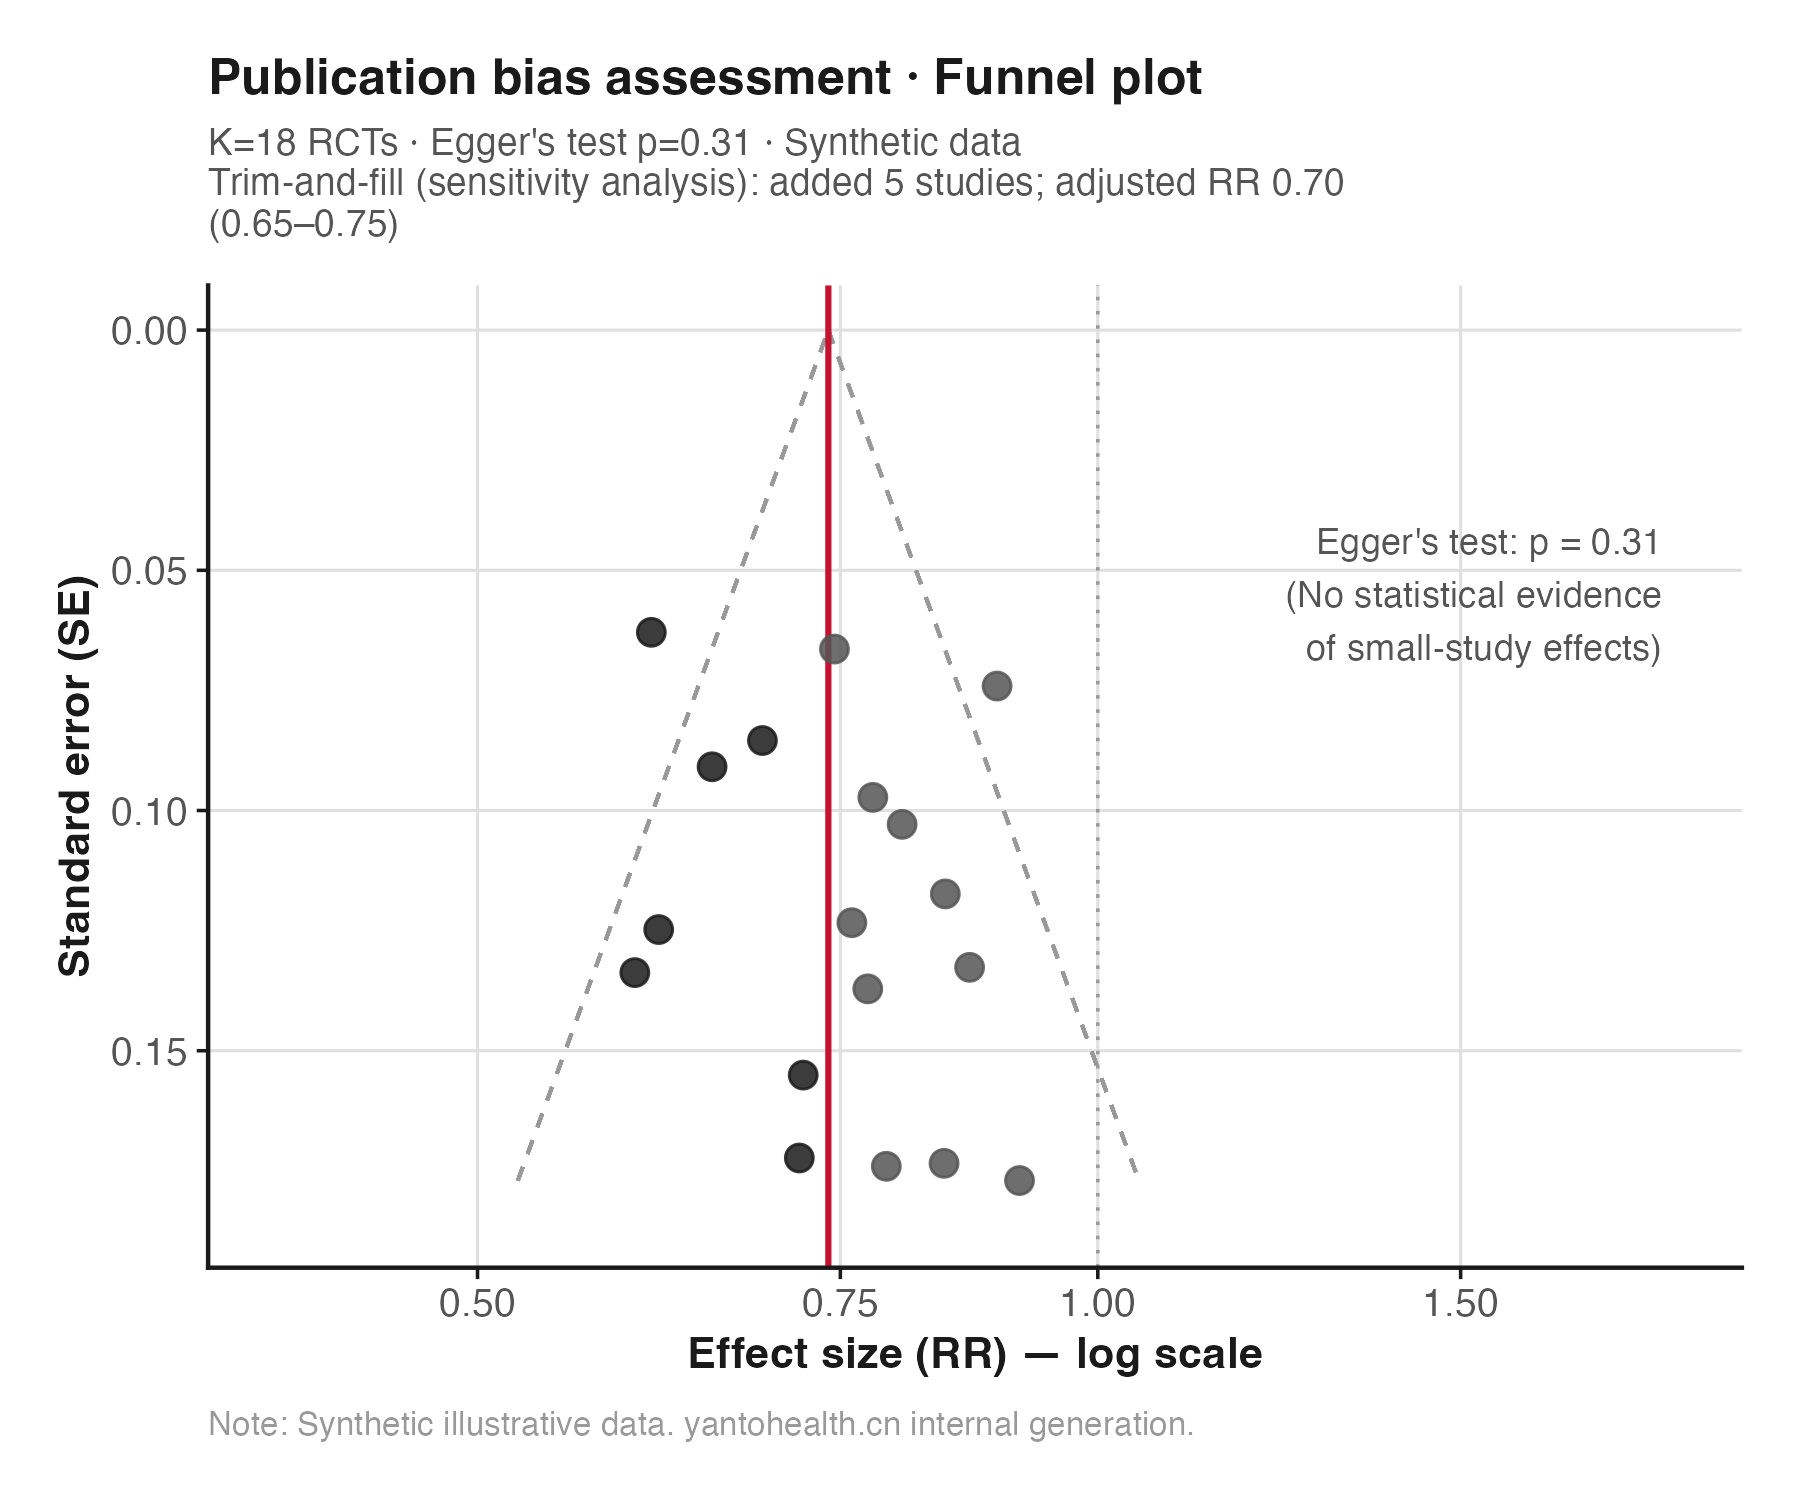
Caption and interpretation limits
K=18 RCTs, Egger test p=0.31, with no statistical evidence of small-study effects. Trim-and-fill adds 5 studies as a sensitivity analysis; adjusted RR=0.70 (95% CI 0.65–0.75), with unchanged effect direction and statistical conclusion. The added studies lie on the stronger-effect side and do not suggest unpublished negative results. The R0 estimator adds 0 studies; the estimators disagree, so these results serve only as a sensitivity reference. The solid red line marks the pooled effect; grey dashed lines mark the 95% pseudo-confidence limits.
02 Clinical Research
Methodological risks
Methodological quality in systematic reviews and meta-analyses rests on three areas: search completeness, avoiding missed important studies; quality assessment of included studies, with systematic risk-of-bias assessment; and an appropriate pooling strategy, considering whether clinical heterogeneity permits quantitative synthesis. Deficiencies in any area can prompt substantive reviewer questions.
A common reviewer concern is pooling studies despite excessive heterogeneity without adequately exploring its sources. I² describes heterogeneity magnitude and cannot alone determine whether to pool; clinical heterogeneity in populations, interventions and outcome windows is central. Meta-regression and subgroup analyses should be planned during Population, Intervention, Comparator, Outcome and Study design (PICOS) development, rather than added in response to reviewer comments.
Methodological priorities: precise PICOS definitions + structured search strategies including sensitivity searches + independent blinded dual-reviewer screening with Kappa reporting + risk-of-bias assessment (RoB 2.0/GRADE) + detailed heterogeneity analysis + dual publication bias tests.
- Broad eligibility criteria produce excessive clinical heterogeneity
- Single-reviewer screening without Kappa reporting
- Unexplained choice of random-effects model
- High I² without meta-regression to explore heterogeneity
- Publication bias assessed only by funnel plot, without Egger/Trim-fill
- No item-by-item rationale for GRADE downgrading
03 Clinical Research
Analytical framework
PICOS refinement and search strategy design
Define each Population / Intervention / Comparator / Outcome / Study design dimension operationally. Combine keywords, MeSH terms and expanded synonyms into search strings for PubMed / Embase / Cochrane / Web of Science. Quality control independently checks the search strategy once, balancing sensitivity to avoid missing important studies and specificity to limit irrelevant records.
Blinded dual-reviewer screening + Kappa agreement assessment
Two independent reviewers screen titles and abstracts, then independently assess full texts. Report Cohen's Kappa at each stage. Resolve disagreements through discussion, with a third reviewer adjudicating unresolved differences; report Kappa and the resolution process in Methods. Prepare the Preferred Reporting Items for Systematic Reviews and Meta-Analyses (PRISMA) flowchart alongside screening, using Covidence / Rayyan as aids.
Data extraction and risk-of-bias assessment
Two reviewers independently extract effect sizes, sample sizes, follow-up duration and other key data, then reconcile and merge them. Use RoB 2.0 for RCTs, Risk Of Bias In Non-randomized Studies of Interventions (ROBINS-I) for observational studies, or Quality Assessment of Diagnostic Accuracy Studies (QUADAS-2) for diagnostic studies. Rate each item and present a risk-of-bias summary figure.
Primary meta-analysis: heterogeneity and model specification
Prespecify the effect model according to anticipated clinical/methodological heterogeneity, rather than I² or heterogeneity test results (Cochrane Handbook section 10.10.4). Describe heterogeneity with I² and τ², report a prediction interval for random-effects analyses, and explore sources using prespecified meta-regression / subgroup analyses. If substantial heterogeneity remains unexplained, reassess whether quantitative pooling is appropriate. State the forest plot ordering criterion (effect size, publication year or weight), and show summary estimates separately for homogeneous subgroups.
Network meta-analysis (including indirect comparisons across interventions)
Build a network using a frequentist framework (mvmeta / netmeta) or Bayesian framework (gemtc). Report relative intervention effects and ranking probabilities (surface under the cumulative ranking curve (SUCRA)). Explicitly report global/local consistency tests and discuss clinical explanations for inconsistent nodes separately.
Publication bias + GRADE evidence quality assessment
With at least 10 studies (Cochrane Handbook chapter 13), assess small-study effects using funnel plots and Egger tests. Use trim-and-fill only as a sensitivity analysis and interpret it cautiously in light of its assumptions. Assess GRADE across five domains (limitations / inconsistency / indirectness / imprecision / publication bias), documenting every downgrade or upgrade. Submit the GRADE summary as a main-text table or online supplement.
04 Clinical Research
Reviewer questions and prevention
The following are illustrative methodological formulations organised by reporting guideline items. They do not reproduce actual reviewer comments or represent any particular journal or reviewer.
On excessive heterogeneity
Illustrative comment · Not an actual reviewer comment
The pooled analysis shows substantial heterogeneity (I²=68%), yet the authors proceed with pooling without adequate exploration of heterogeneity sources. Meta-regression was not performed, and the subgroup analyses were not pre-specified in the protocol. The clinical validity of pooling these studies remains questionable.
Prevention: prespecify at least 3 subgroup categories during PICOS development (population, intervention dose/duration and follow-up duration), and meta-regression variables such as publication year, sample size and risk-of-bias rating. Use the protocol's prespecified effect model without switching based on I²; report I² and τ², with a prediction interval for random-effects analysis to describe the possible effect distribution. State in Methods that subgroup and meta-regression plans were preregistered in PROSPERO.
On search completeness
Illustrative comment · Not an actual reviewer comment
The authors only searched PubMed and Cochrane. Major databases such as Embase and Web of Science were not included, which may have led to selective inclusion of studies. Additionally, grey literature and conference abstracts were not searched, raising concerns about publication bias beyond what funnel plots can detect.
Prevention: search PubMed + Embase + Cochrane + Web of Science and supplement with ClinicalTrials.gov records to identify unpublished data. Provide complete search strings as Supplementary Table S1. Report database search and grey literature search record counts in separate branches of the PRISMA flowchart.
On GRADE ratings
Illustrative comment · Not an actual reviewer comment
The authors conclude the evidence is of "moderate quality," but no GRADE assessment table is provided. The basis for upgrading or downgrading the evidence level is not transparent, making it impossible to evaluate whether the overall confidence rating is appropriate.
Prevention: generate a standard GRADE evidence table using GRADEpro GDT and explain downgrading or upgrading in each of the five domains. Present it in the main text or online supplement. Conclusions should match the GRADE rating; evidence rated "low quality" should not be described as "the evidence strongly supports".
05 Clinical Research
Deliverables
| Deliverables | Specifications and content |
|---|---|
| Structured search strategy document | Complete search strings for four databases + search dates + result counts, ready for Supplementary Table S1. |
| PRISMA 2020 flowchart | All exclusion steps from database search to final inclusion, delivered in editable PowerPoint/EPS format so journal editors can adjust formatting directly. |
| Risk-of-bias figures (RoB 2.0 / QUADAS-2) | Study-level and summary risk-of-bias ratings, with standard risk-of-bias summary figures generated using robvis, ready for the main text. |
| Forest plots + funnel plots + Trim-fill plots | Complete primary and subgroup analysis figures in 300 DPI TIFF format, with R code using meta / metafor included. |
| GRADE evidence quality table | GRADEpro GDT export with five-domain assessment for each outcome, ready for the main text or online supplement. |
06 Clinical Research
Engagement scope and guidance
Commissioning statistical analysis separately
Yes. Statistical analysis can be commissioned independently, covering primary meta-analysis, heterogeneity exploration, publication bias tests and network meta-analysis where appropriate, using extracted data. Before starting, we check the extraction table format and variable completeness. We explain any material flaws in the search strategy or extraction and advise whether supplementary searching is needed.
Pooling when I² exceeds 75%
This depends on context. I² quantifies heterogeneity and is not an absolute threshold prohibiting pooling. The key questions are whether clinical heterogeneity can be explained and whether the pooled estimate remains clinically meaningful. Prespecify the model according to anticipated clinical/methodological heterogeneity, rather than I²; report I², τ² and a prediction interval, and explore heterogeneity through prespecified subgroups and meta-regression. If heterogeneity is unexplained and pooling is not meaningful, we explain this, recommend a qualitative systematic review and do not begin quantitative pooling.
Evidence requirements for network meta-analysis
There is no fixed minimum study count. Credibility depends on network geometry and the number of studies in each loop. Where comparisons have few studies, precision and consistency assessment are limited; this is explicitly reported in Methods and the limitations. Assessment starts with a network plot to establish whether connectivity and the evidence base support network meta-analysis.
Related services
Study design
PICOS refinement + PROSPERO preregistration preparation + search strategy review. For meta-analysis, we recommend involvement before literature screening begins.
Writing and revision
Item-by-item PRISMA self-check + full-manuscript language editing + cover letter preparation + point-by-point responses to reviewers' heterogeneity concerns.
Statistical analysis
Primary meta-analysis + subgroups + meta-regression + network meta-analysis + three publication bias assessments, with code included.
Get started · Methodology assessment
Book a methodology assessment
Submit your research question, available data and intended outputs. Reply within 24 hours (business days first), with feasibility feedback, viable statistical approaches and a recommended package in our first response.
Our involvement in a paper is disclosed truthfully: where our staff meet the authorship criteria of the International Committee of Medical Journal Editors (ICMJE), they are listed as authors under our company's real affiliation; any other contribution is stated in the acknowledgements. Acceptance is decided by the journal editorial office and peer review. We do not promise publication outcomes.