
Clinical Research Services
Real-world data study
Health insurance databases offer large samples and long follow-up, but methodological flaws also grow with scale. Mishandling time-varying covariates, International Classification of Diseases (ICD) mapping errors and inconsistent cohort eligibility can each introduce systematic bias.
All data and figures on this page are Illustrative data and do not represent actual patients, hospitals or client projects.
- Initially at risk
- 8,200
- Landmark follow-up intervals (0–60 months)
- 5 intervals
- Core analytical framework
- Time-varying Cox
- Independent databases (pooled)
- 4 databases
01 Clinical Research
Methodological figures
Illustrative data show analytical approaches and presentation only; they do not represent actual project results.
Illustrative data. All figures and numbers on this page are Illustrative data (synthetic), generated by Yanto Health using R simulation scripts. They do not represent any actual patients, hospitals or client projects. Generation scripts are available on request.
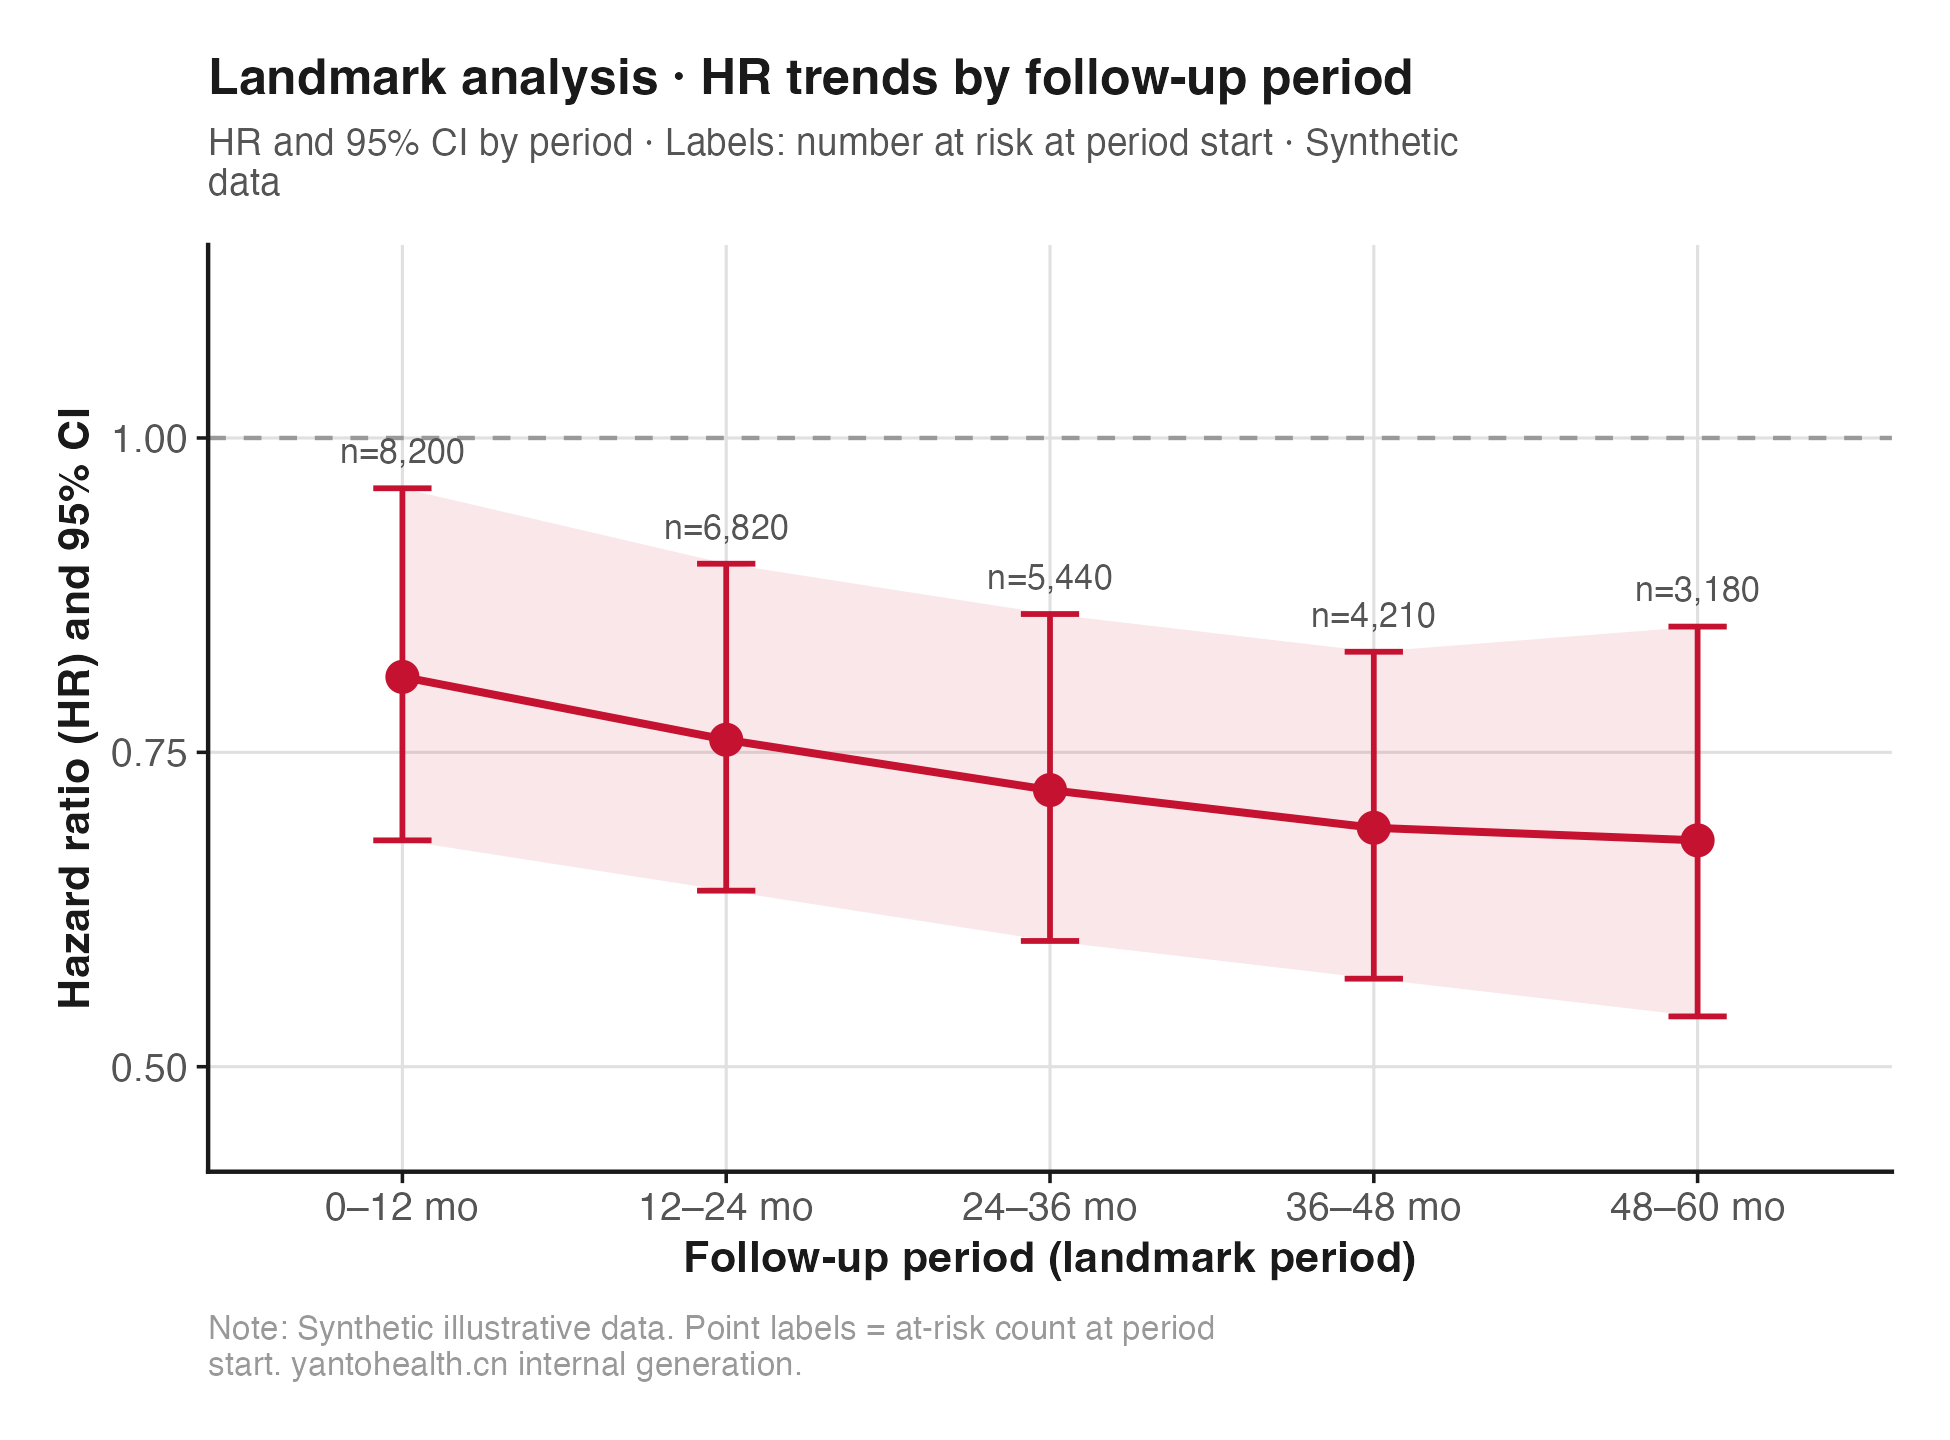
Caption and interpretation limits
Hazard ratios are estimated separately for five follow-up intervals: 0–12 / 12–24 / 24–36 / 36–48 / 48–60 months (HR 0.81 → 0.68). Numbers at risk at each interval's start appear above the points. Assess proportional hazards using Schoenfeld residuals and plots; use time-dependent covariates or time stratification if the assumption fails.
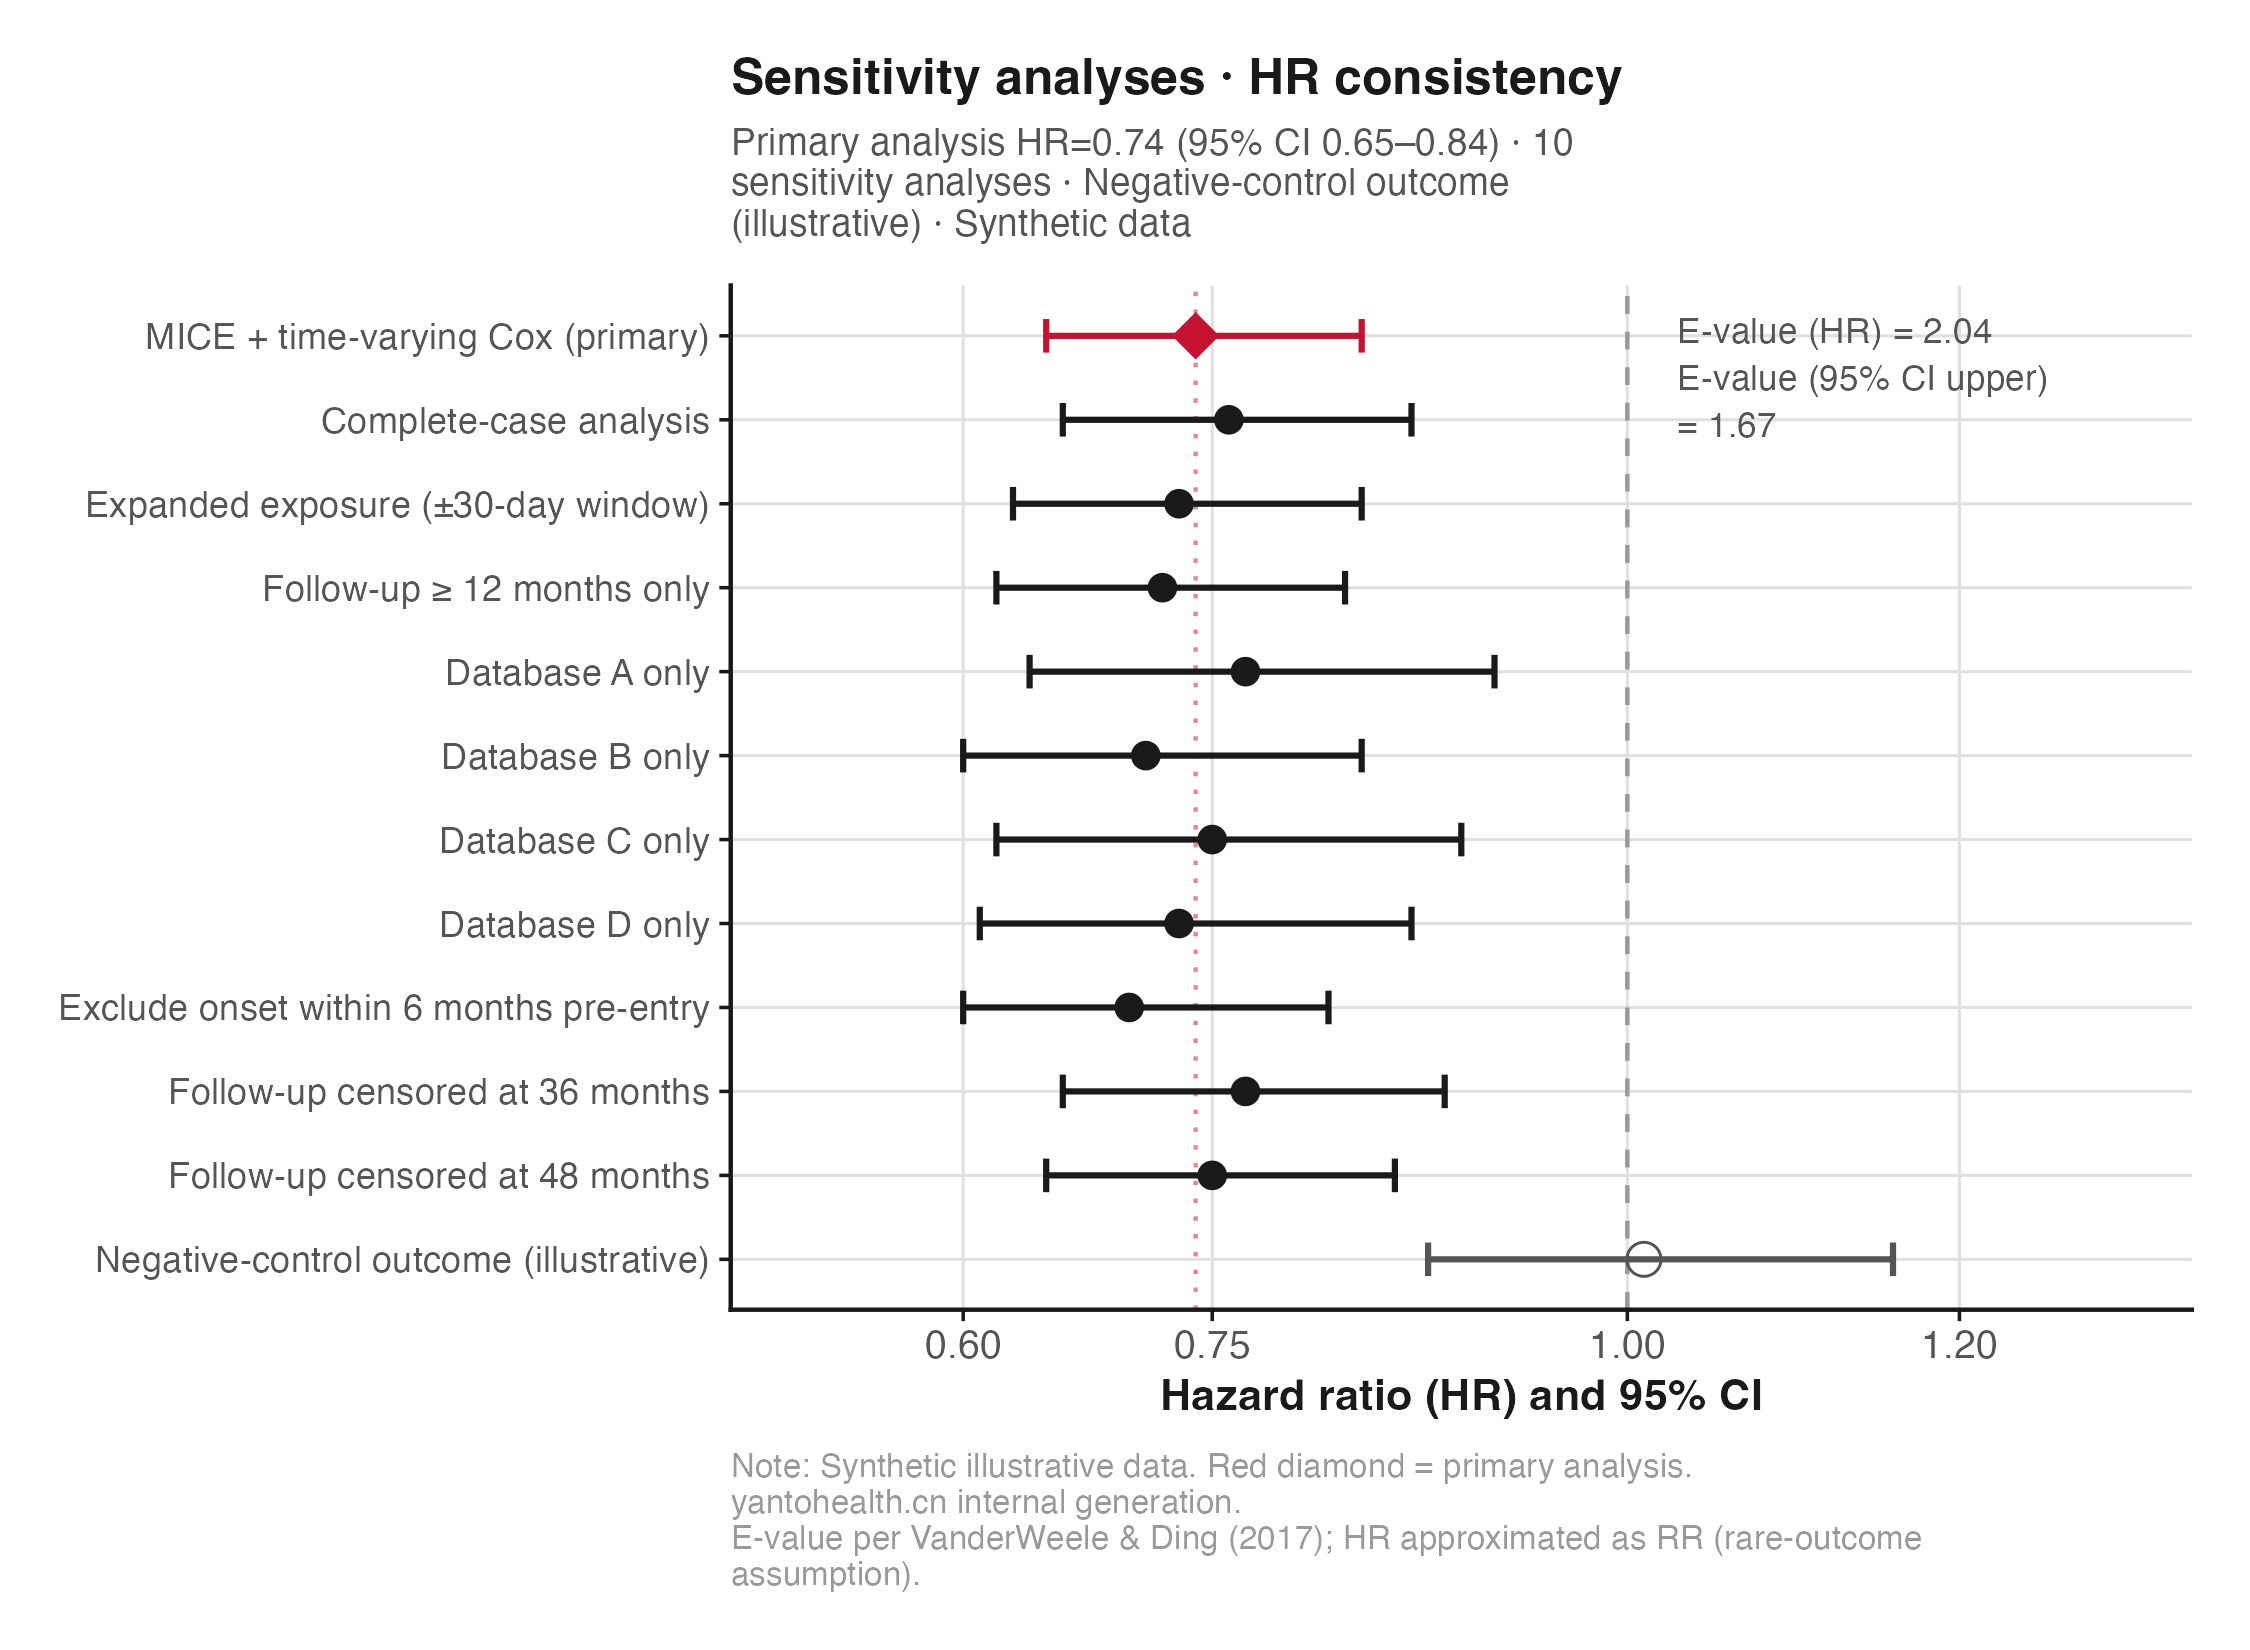
Caption and interpretation limits
The primary analysis (red diamond) and 10 sensitivity analyses have consistent effect directions. The illustrative negative control outcome HR=1.01 (95% confidence interval (CI) 0.88–1.16) crosses the null. This outcome is illustrative only; actual studies must select an outcome with no known causal association with exposure. A null negative control association does not exclude residual confounding. E-values use VanderWeele and Ding's (2017) formula: 2.04 for the HR point estimate and 1.67 for the upper 95% CI limit, assuming a rare outcome so HR approximates relative risk (RR).
02 Clinical Research
Methodological risks
Real-world data (RWD) from health insurance databases and electronic medical records (EMRs) present different methodological challenges from randomised controlled trials (RCTs): large volumes with variable quality, ICD version differences and coding practice variation, incomplete comorbidity records, and time-related biases including immortal time bias, time-varying confounding and competing risks.
Common reviewer questions concern two issues. First, unclear index-date definitions allow immortal time into the analysis, creating a systematically spurious protective effect in the exposed group. Second, long-term chronic disease studies may ignore time-varying covariates: comorbidities, medications and blood pressure change during follow-up, so baseline-only modelling biases effect estimates.
Methodological priorities: rigorous ICD mapping + aligned exposure/follow-up timelines + multiple imputation for extensive missingness + Cox models with time-varying covariates + prespecified sensitivity analyses (see step 05 and Fig 2) + negative control outcomes + E-values.
- Immortal time bias: misaligned exposure window and follow-up start
- Mixed ICD-9/ICD-10 codes without harmonised mapping
- Extensive missing comorbidity/medication records without missingness mechanism assessment
- Baseline-only values for time-varying covariates (temporal confounding)
- No between-cohort consistency assessment before pooling databases
- Competing events ignored during long follow-up
03 Clinical Research
Analytical framework
ICD mapping and data standardisation
Build a bidirectional ICD-9 → ICD-10 mapping table including common clinical synonymous codes. Check primary diagnoses, secondary diagnoses and procedure codes in each database. Deliver a standardised variable dictionary and cross-database frequency distributions for each key variable. Unusual distributions often indicate coding practice differences; explain the handling strategy in Methods.
Precise exposure/follow-up timeline definitions
Define three dates: ① cohort entry date; ② exposure start (index date, which must be ≥ entry date); ③ event or censoring date. Counting the waiting period from entry to index as exposed follow-up introduces immortal time bias. Avoid this through landmark analysis or time-conditional exposure definitions.
Extensive missingness (multiple imputation by chained equations (MICE))
Real-world data often have substantial missingness, such as 15–40% for laboratory measures. MICE generates 10–20 imputed datasets; fit models separately and pool effects using Rubin's rules. Include outcome variables in imputation models (the event indicator and Nelson-Aalen cumulative hazard for survival outcomes); otherwise imputed values' association with outcomes is weakened and estimates move towards the null (Moons et al., 2006; White and Royston, 2009). Report a missingness matrix for key variables.
Cox regression with time-varying covariates
Represent changing follow-up covariates such as blood pressure, medication and comorbidities in counting-process start-stop format. Use R's survival package for time-varying Cox models and tmerge() to construct data frames. Proportional hazards assessment using Schoenfeld residuals still applies; introduce time stratification if violated.
Sensitivity analyses and negative controls
Conduct sensitivity analyses around the primary analysis: ① complete cases versus MICE; ② expanded exposure definitions (±30-day window); ③ follow-up restricted to ≥12 months; ④ separate analyses by database; ⑤ exclusion of patients with disease onset within 6 months before entry; ⑥ alternative follow-up end dates. Also analyse a negative control outcome theoretically unaffected by exposure to detect residual confounding signals, and calculate E-values to quantify the strength threshold residual confounding would need to reach.
04 Clinical Research
Reviewer questions and prevention
The following are illustrative methodological formulations organised by reporting guideline items. They do not reproduce actual reviewer comments or represent any particular journal or reviewer.
On immortal time bias
Illustrative comment · Not an actual reviewer comment
The exposure definition requires at least 90 days of continuous medication use, but follow-up begins at cohort entry. Patients who survive the first 90 days are by definition immortal during that period. This immortal time has been incorrectly assigned to the exposed group, potentially creating a spurious protective association.
Prevention: start follow-up when the exposure definition is met (index-date approach), or explain how immortal time is assigned to the unexposed period in a time-conditional analysis. Describe timeline definitions in a separate Methods paragraph and illustrate entry, index and event dates in a figure.
On database quality and coding errors
Illustrative comment · Not an actual reviewer comment
The study relies on administrative claims data, which are known to have coding errors and misclassification. The accuracy of the exposure and outcome definitions based on ICD codes has not been validated against medical records. This introduces substantial measurement error that may bias the results in unpredictable directions.
Prevention: cite previous validation studies for the coding definition where available, or explain that the study uses a recognised disease-specific ICD algorithm with references. Supply primary outcome ICD codes as a supplement. Acknowledge possible coding errors in the limitations and explain how requiring multiple diagnostic codes (at least 2 diagnosis records) reduces false positives.
On consistency across databases
Illustrative comment · Not an actual reviewer comment
The authors combined four separate cohorts from different databases. No assessment of inter-database heterogeneity is provided. Differences in coding practices, patient populations, and data collection methods across databases may compromise the validity of pooled estimates.
Prevention: stratify analyses by database before pooling. Describe between-cohort heterogeneity using I² and τ². If effect directions agree, explain the clinical rationale for pooling. Prespecify fixed-effect or random-effects pooling in the analysis plan and describe it in Methods; do not switch ad hoc based on I². Provide a cross-database baseline comparison as an extended Table 1 in the supplement.
05 Clinical Research
Deliverables
| Deliverables | Specifications and content |
|---|---|
| ICD mapping table + data quality report | Bidirectional ICD-9/10 mappings, cross-database key-variable frequency comparisons and missingness matrices, suitable as a supplementary table. |
| Timeline definition document + visualisation | Written definitions of entry, index and event dates, with an illustrative figure suitable for main-text Figure 1 or a supplement, explicitly explaining immortal time handling. |
| MICE code + imputation diagnostics | R code using mice, with imputation model specifications and convergence trace plots, 10–20 imputed datasets and a report of Rubin's rules pooled results. |
| Time-varying Cox code + figure package | tmerge() data construction + survival::coxph() model + time-varying Kaplan-Meier curves + subgroup forest plots, with code and 300 DPI TIFF figures included. |
| Sensitivity analysis summary + E-values | Sensitivity results including MICE versus complete cases and negative control outcomes, plus E-value calculations, ready for citation in Methods and Discussion. |
| REporting of studies Conducted using Observational Routinely-collected health Data (RECORD) / Strengthening the Reporting of Observational Studies in Epidemiology (STROBE) checklist | Item-by-item RECORD checks (the STROBE extension for real-world and routinely collected health data), with corresponding text locations, ready to submit as a reporting checklist supplement. |
06 Clinical Research
Engagement scope and guidance
Assessing hospital information system data structure
We can work with these data, but must assess structure before signing. Checks cover export formats (Excel/CSV/Access), unique patient IDs for key variables, complete dates (admission/discharge/diagnosis/medication) and missing key variables. If fundamental structure is severely incomplete, such as missing cross-table patient IDs, key dates or most key variables, we explain whether proceeding is worthwhile. We do not take on the project before data assessment is complete.
Differences across 4 databases and conditions for pooling
The standard approach is to analyse each database separately, assess agreement in effect direction and magnitude, then decide whether to pool. Table 1 compares baseline characteristics with standardised mean differences; Methods explains between-database heterogeneity assessment. Where results differ materially, we do not force pooling and discuss the difference as a study finding.
Follow-up beyond 10 years and time-varying confounding
This is technically feasible at an acceptable computational cost. The key decision is which covariates should vary over time: usually medications, key comorbidities and laboratory measures that change materially during follow-up, while relatively stable demographics remain fixed. Explain the selection rationale in Methods. If time-varying confounders are also affected by previous exposure, direct adjustment in time-varying Cox models may introduce bias. Consider g-methods such as marginal structural models with inverse probability weighting (Robins et al., 2000).
Interpreting negative control outcomes
A negative control outcome is a sensitivity analysis tool for detecting residual confounding. Select an outcome with no known causal association with exposure but potentially sharing confounders with the primary outcome (Lipsitch et al., 2010). A protective effect or increased risk may indicate residual confounding or other systematic bias; no association does not exclude residual confounding. At project start, we agree an appropriate outcome with the client and confirm the absence of a known causal association using domain literature. Results form part of sensitivity analyses.
Related services
Statistical analysis
Time-varying Cox / MICE / competing risks / propensity scores, including sensitivity analyses and independent recalculation by quality control according to package tier; code included.
Study design
Timeline definitions + prespecified directed acyclic graph (DAG) + negative control outcome planning + draft RECORD checklist. We recommend involvement before database lock.
Writing and revision
RECORD/STROBE self-check + Methods section standardisation + point-by-point responses to ICD coding/time-varying confounding concerns.
Get started · Methodology assessment
Book a methodology assessment
Submit your research question, available data and intended outputs. Reply within 24 hours (business days first), with feasibility feedback, viable statistical approaches and a recommended package in our first response.
Our involvement in a paper is disclosed truthfully: where our staff meet the authorship criteria of the International Committee of Medical Journal Editors (ICMJE), they are listed as authors under our company's real affiliation; any other contribution is stated in the acknowledgements. Acceptance is decided by the journal editorial office and peer review. We do not promise publication outcomes.