
Clinical Research Services
Retrospective cohort study
The central methodological challenge in large multicentre retrospective cohorts is rigorous control of selection bias and confounding, rather than model complexity. Identifying immortal time bias or incorrect collider adjustment during peer review makes subsequent remediation costly.
All data and figures on this page are Illustrative data and do not represent actual patients, hospitals or client projects.
- Participants after matching
- N=2,840
- Follow-up window
- 60 months
- Core analytical framework
- PSM+Cox
- All covariates after matching
- Standardised mean difference (SMD)<0.10
01 Clinical Research
Methodological figures
Illustrative data show analytical approaches and presentation only; they do not represent actual project results.
Illustrative data. All figures and numbers on this page are Illustrative data (synthetic), generated by Yanto Health using R simulation scripts. They do not represent any actual patients, hospitals or client projects. Generation scripts are available on request.
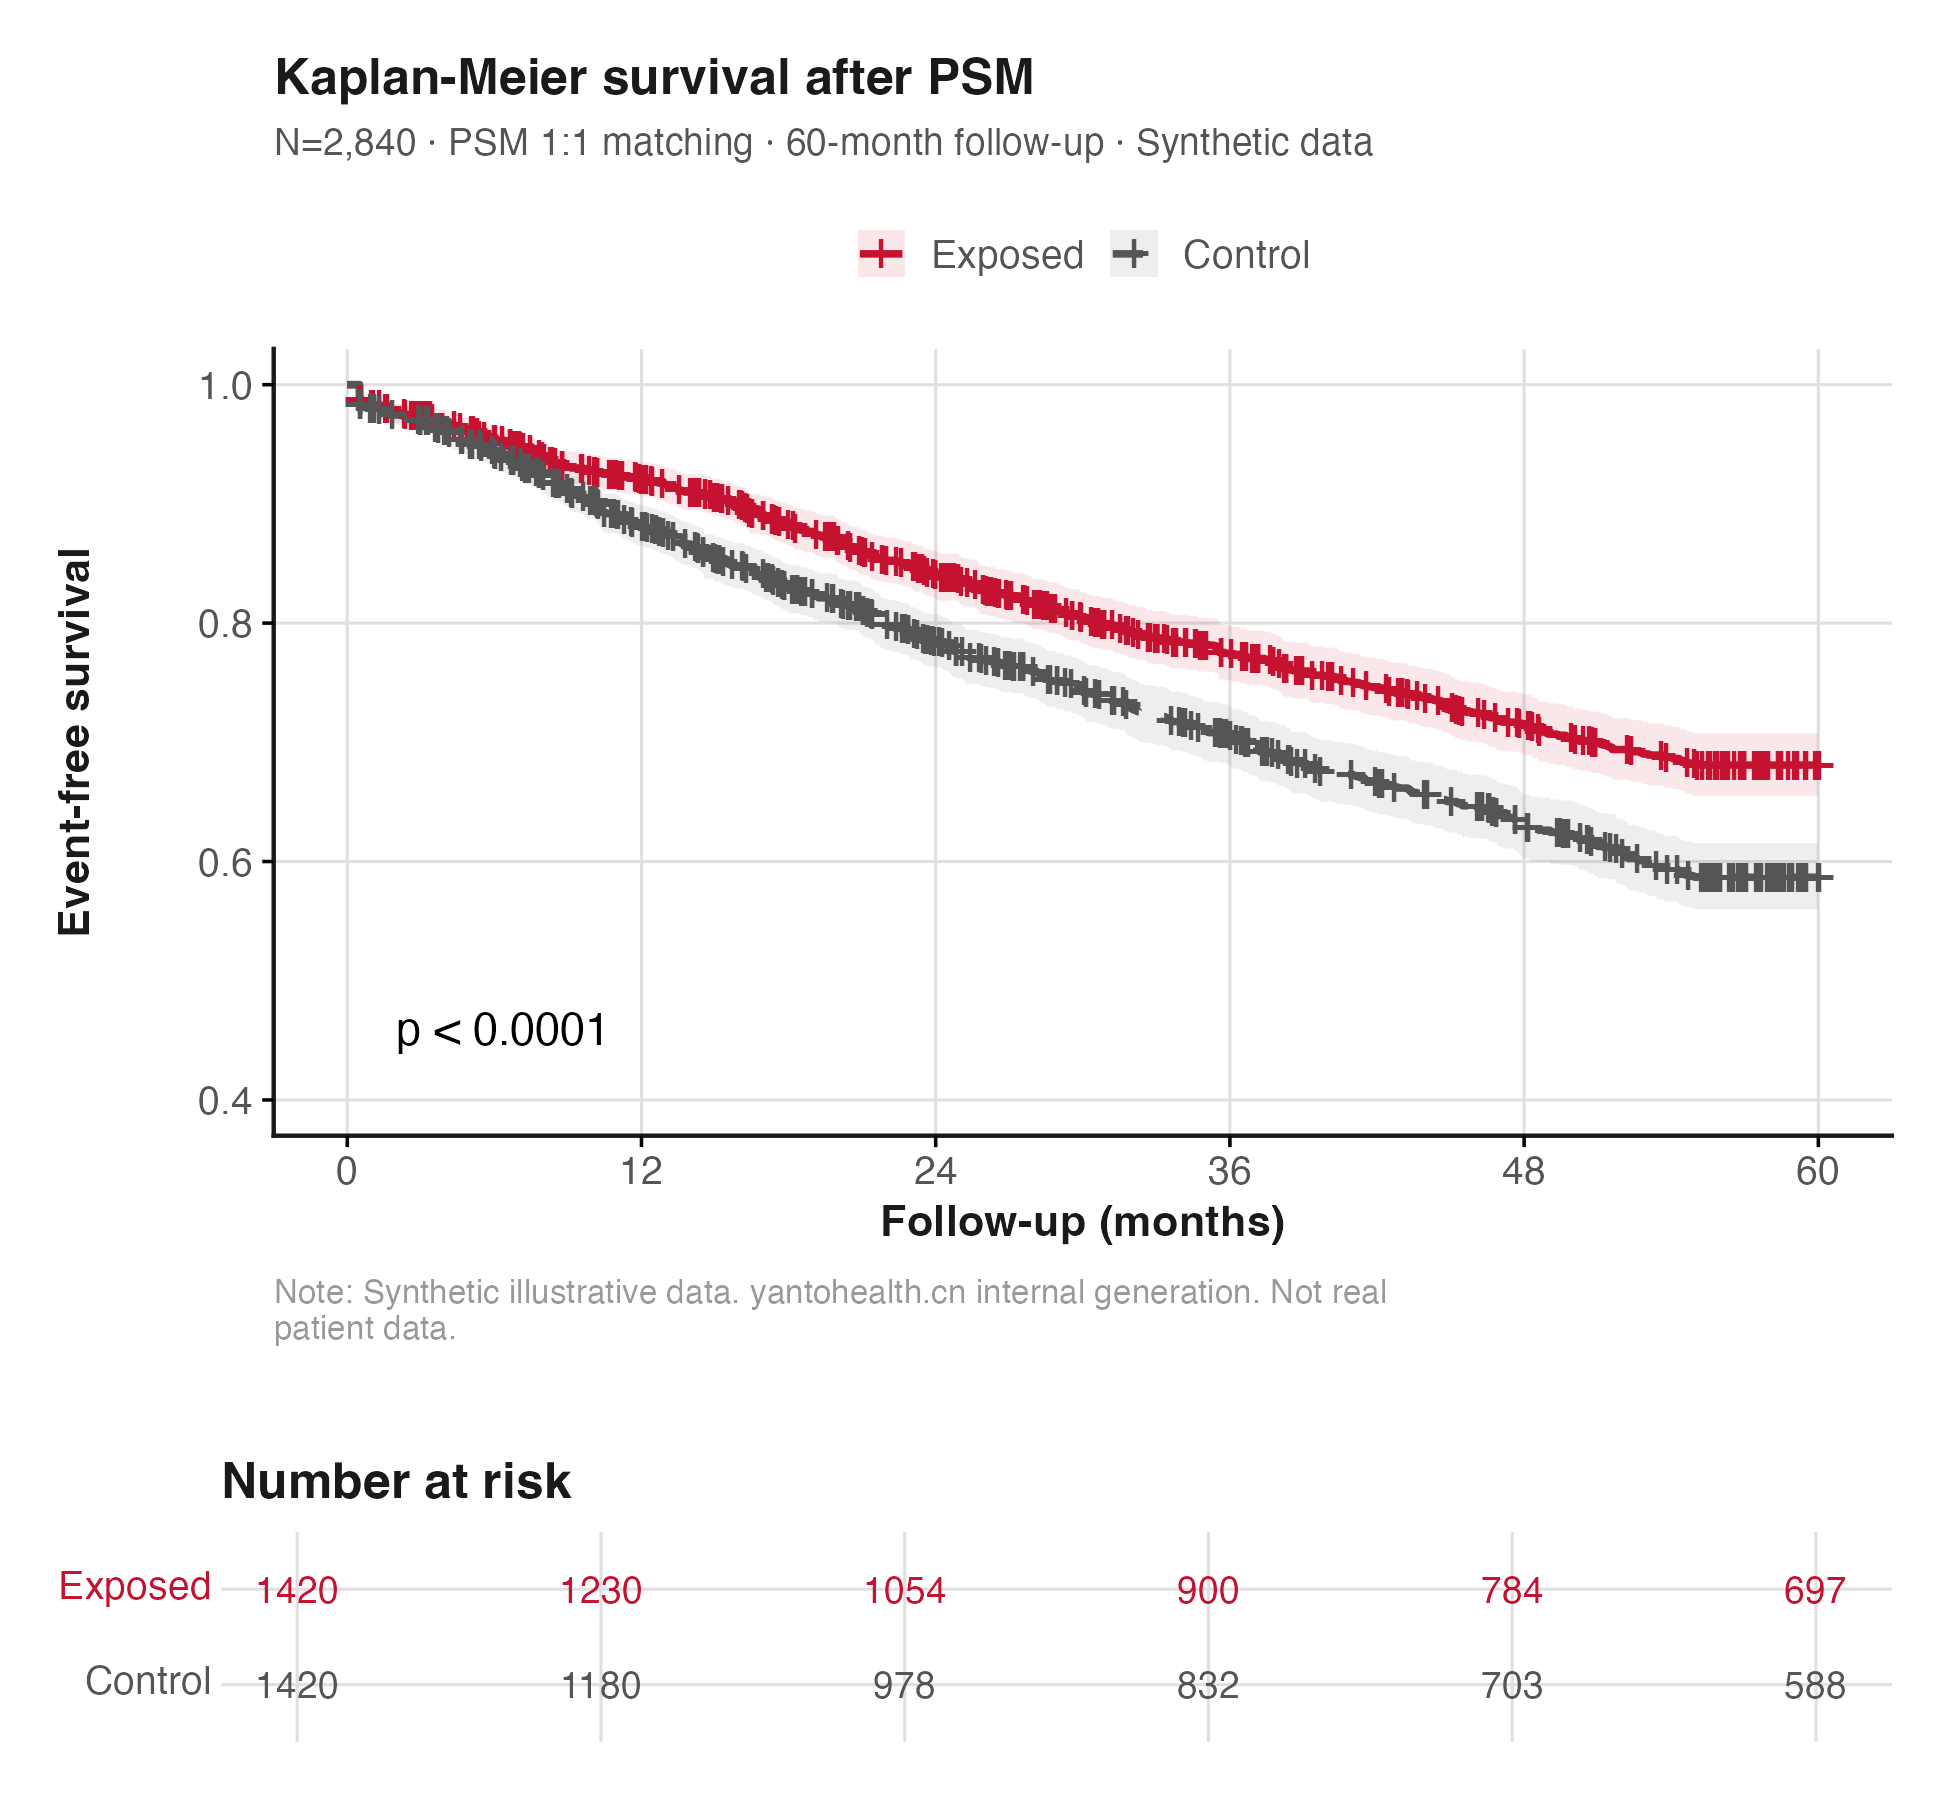
Caption and interpretation limits
Event-free survival probabilities in exposed and control groups after 1:1 PSM, with an at-risk table and log-rank p value.
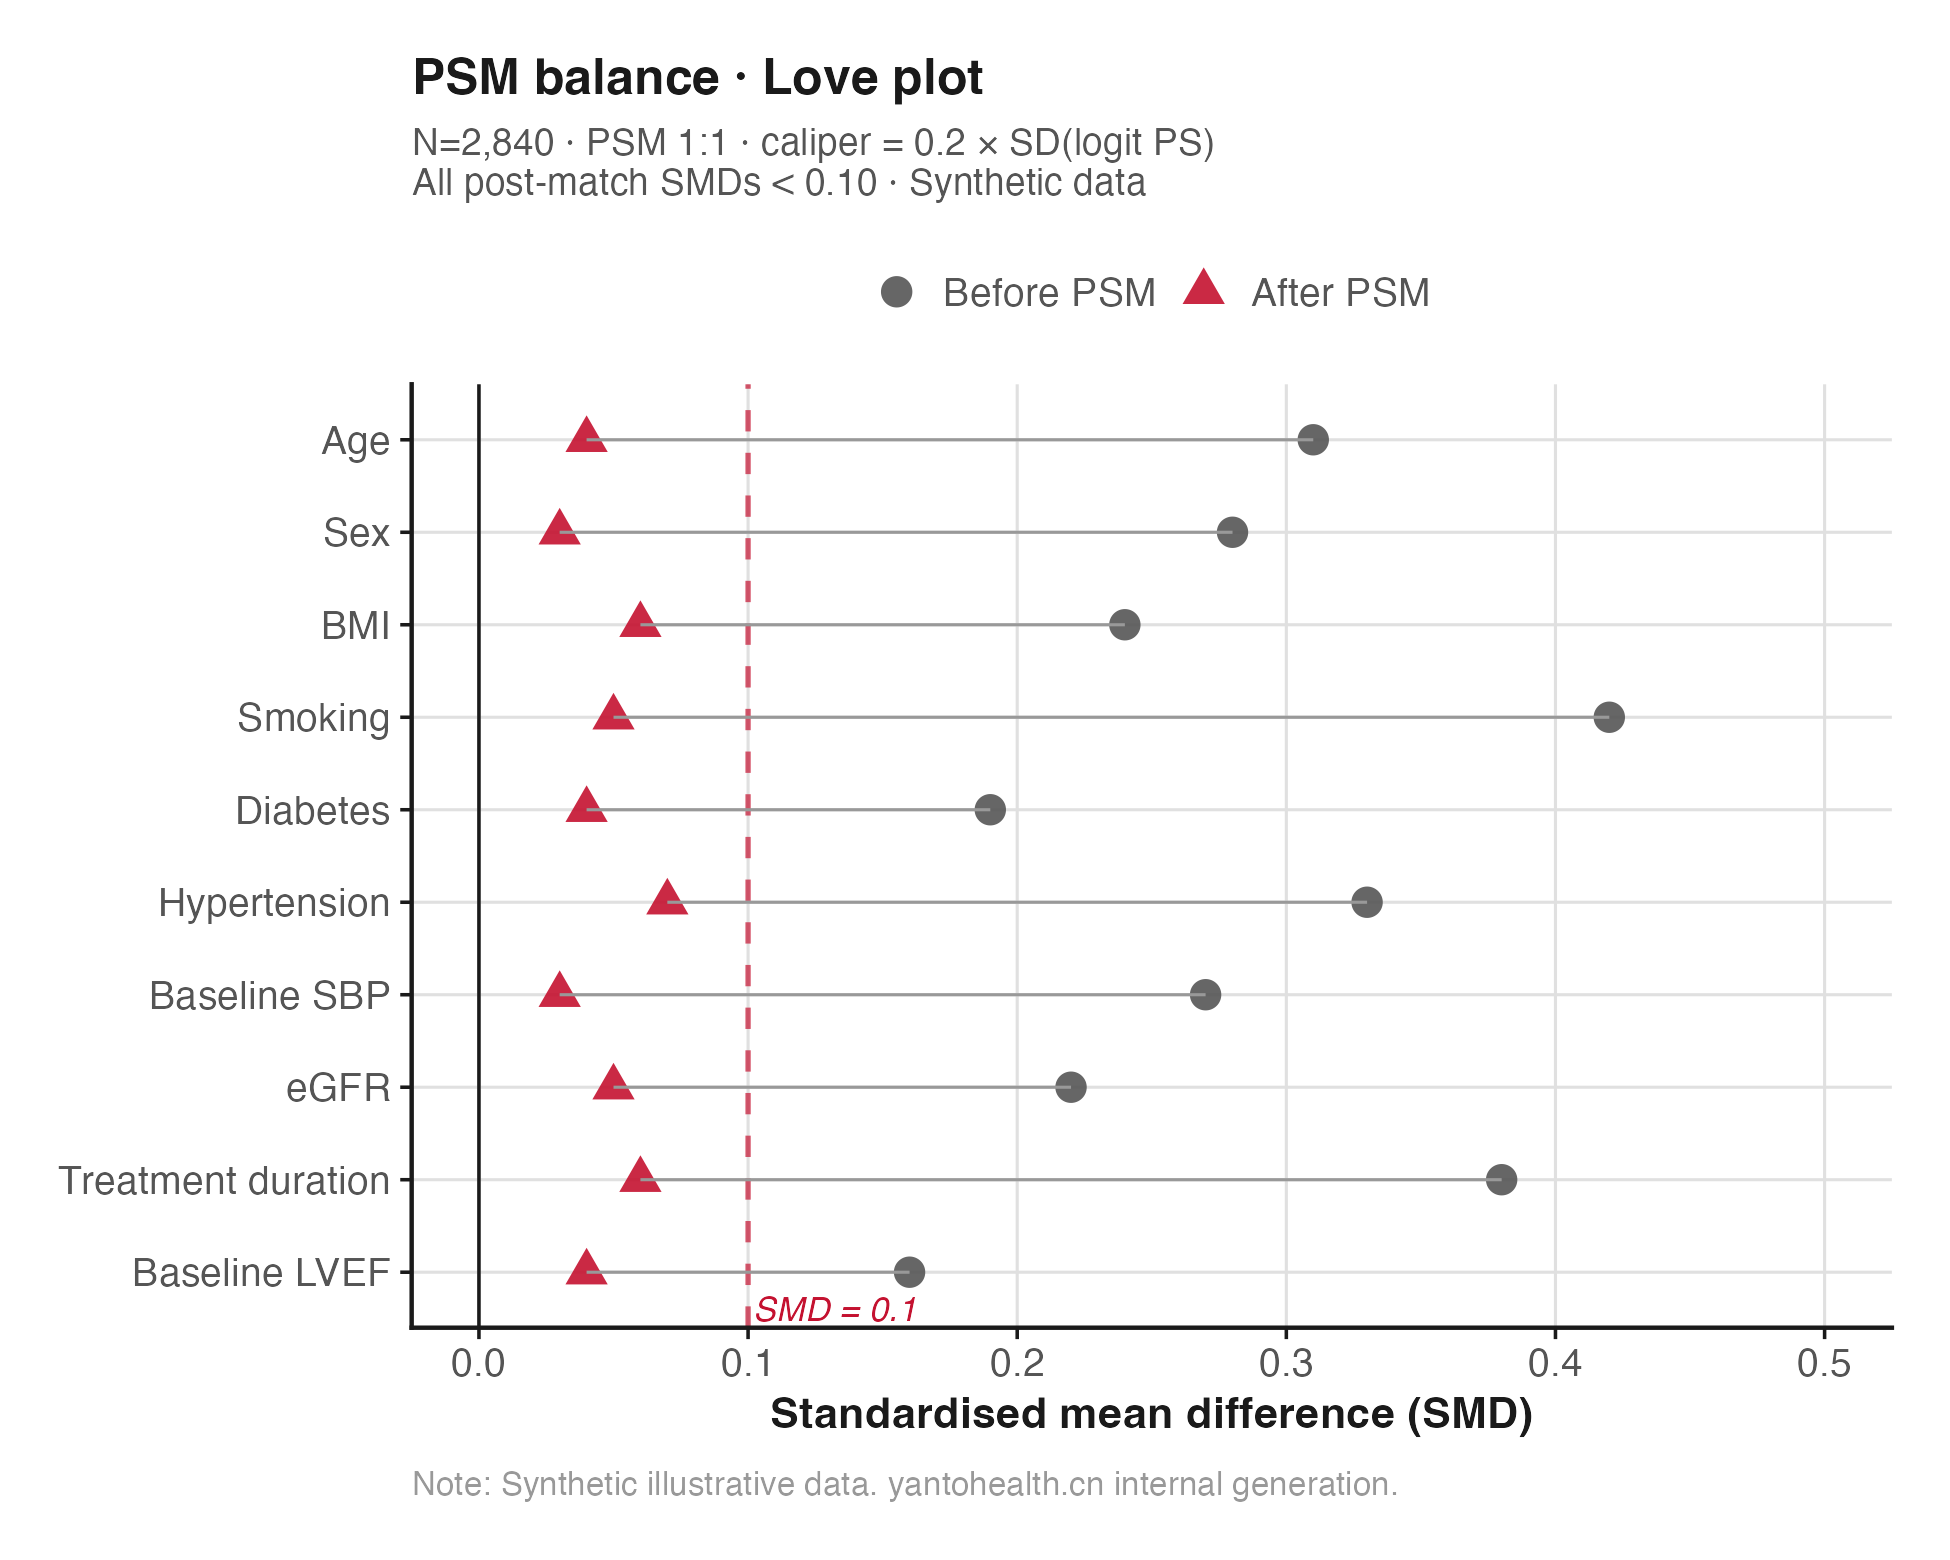
Caption and interpretation limits
Standardised mean differences (SMDs) for 10 baseline covariates before and after matching. All post-matching SMDs are<0.10, meeting the baseline comparability criterion; the red dashed line marks the SMD=0.1 threshold.
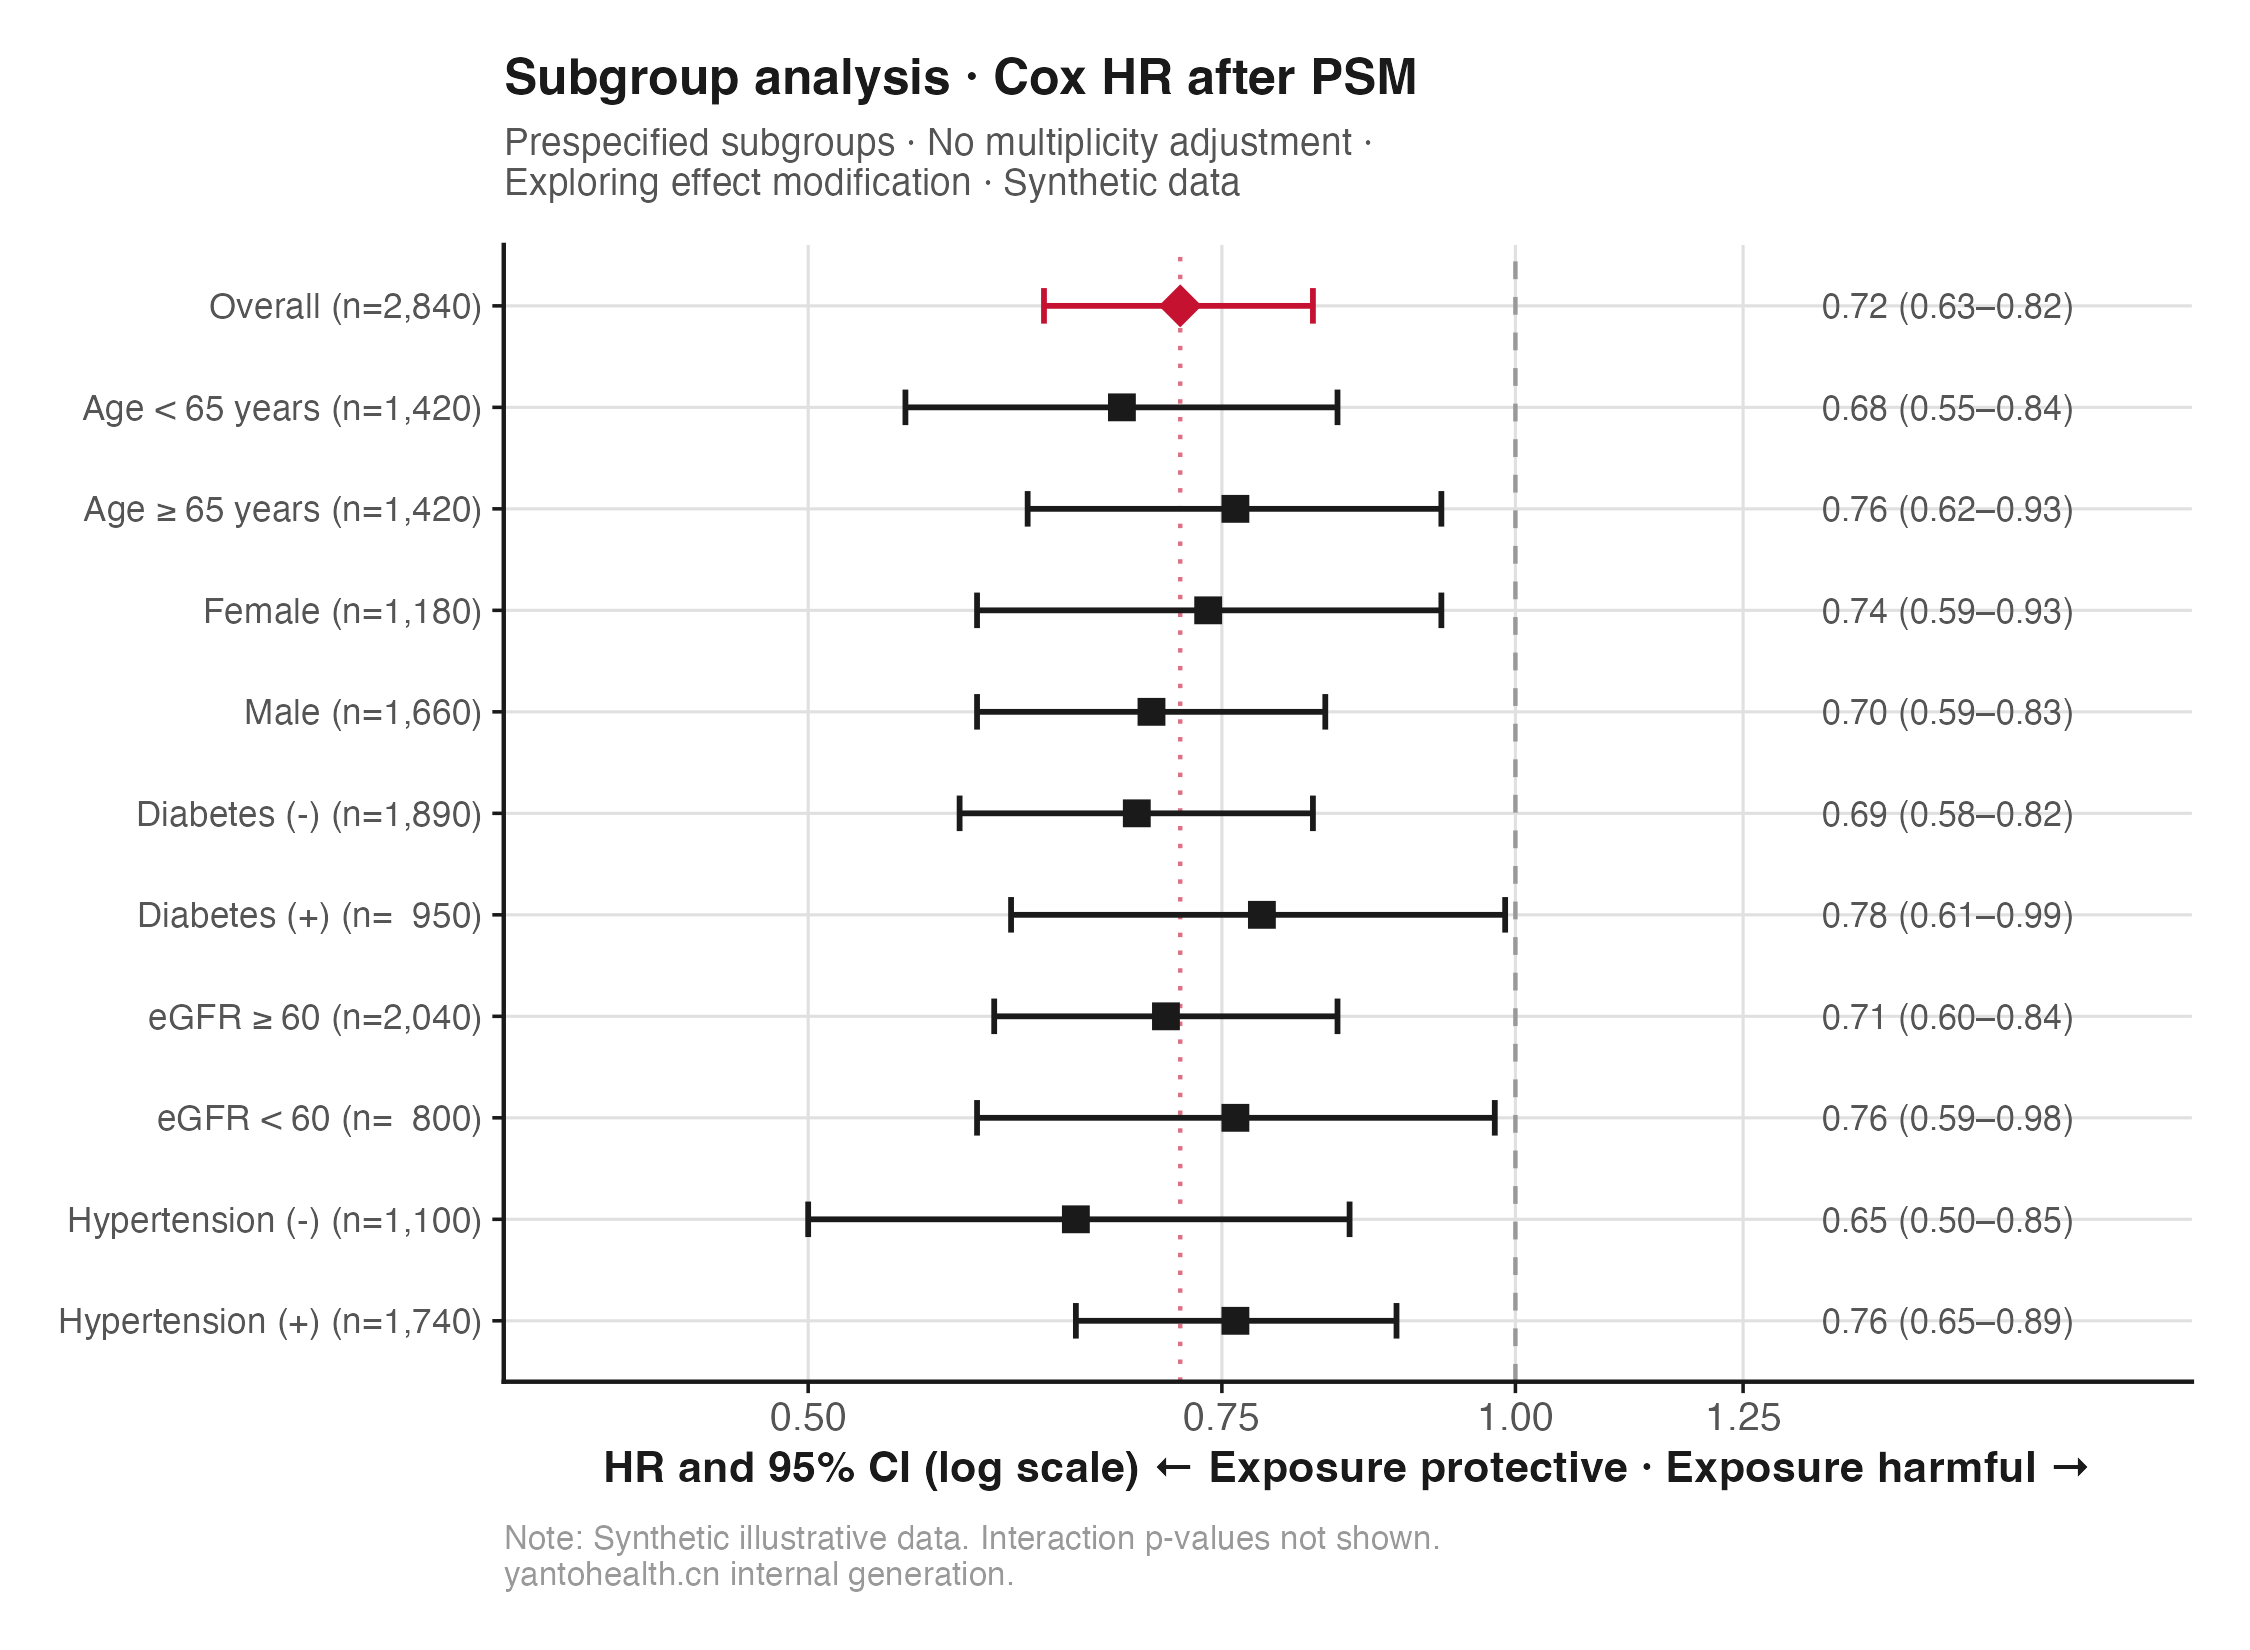
Caption and interpretation limits
Exploratory analysis of post-matching Cox hazard ratios (HRs) across 5 prespecified stratification dimensions (10 subgroups in total). No multiple-comparison correction was applied, and interaction p values are not reported in the figure. Results only suggest possible effect modification and do not establish consistency. The red diamond shows the overall HR of 0.72 (95% confidence interval (CI) 0.63–0.82); the horizontal axis is logarithmic.
02 Clinical Research
Methodological risks
A common barrier to publication in large multicentre retrospective cohorts is inadequate control of three methodological biases, rather than insufficient sample size: selection bias (incomparable exposed and control groups at baseline), measurement bias (inconsistent exposure/outcome definitions across centres), and confounding bias (adjustment that does not distinguish confounders, mediators and colliders).
Reviewer questions in cohort studies focus on two issues: whether baseline comparability was achieved after PSM and the specific post-matching SMDs; and whether immortal time bias was considered when adjusting for many variables, with aligned exposure and follow-up start times. Without prespecified strategies before modelling, remedial work after submission often requires data recleaning or additional analyses, substantially extending timelines.
Methodological priorities: precise exposure windows + PSM matching quality assessment + directed acyclic graph (DAG)-guided confounding adjustment + at least 3 types of sensitivity analysis (inverse probability of treatment weighting (IPTW) as an alternative / broader versus stricter outcome definitions / complete cases versus multiple imputation) + E-value reporting.
- Immortal time bias: exposure starts after follow-up
- Post-matching PSM SMD >0.1 without explanation
- Including a collider in the adjustment set introduces new bias
- Inconsistent exposure/outcome coding across centres
- Unaddressed competing risks (competing deaths)
- Unplanned subgroup analyses without multiple-comparison correction
03 Clinical Research
Analytical framework
Data standardisation and exposure definition
When pooling multicentre data, check each centre's International Classification of Diseases (ICD) code versions, exposure definition windows and outcome criteria. The exposure start (index date) must precede the start of follow-up to avoid immortal time bias. Outputs: harmonised variable dictionary + data quality report.
DAG construction and confounder selection
Before modelling, use DAGitty to draw a directed acyclic graph identifying confounders (adjust), mediators (do not adjust or analyse separately) and colliders (do not adjust; adjustment introduces collider bias). Select covariates using the minimally sufficient adjustment set (MSAS), rather than including every measurable variable.
1:1 PSM + quality assessment
Use nearest-neighbour matching with a caliper of 0.2 times the standard deviation of the propensity score logit (Austin, 2011). Calculate post-matching standardised mean differences (SMDs) for each variable, targeting SMD<0.1. Include a Love plot as a supplementary figure. If SMDs remain high, adjust the caliper or use IPTW, explaining the choice in Methods.
Cox proportional hazards models and time-to-event analysis
Primary analysis: post-matching Cox regression with cluster-adjusted standard errors (SEs), reporting HR + 95% CI + Kaplan-Meier time-to-event curves. Test proportional hazards using Schoenfeld residuals; if violated, introduce time-dependent covariates or stratified analyses with restricted time windows.
Sensitivity analyses and E-value reporting
Perform at least 3 types of sensitivity analysis: IPTW as an alternative to PSM; broader versus stricter primary outcome definitions; and complete-case analysis versus multiple imputation by chained equations (MICE). Calculate the E-value to quantify the minimum strength threshold for residual confounding and report it in Discussion.
04 Clinical Research
Reviewer questions and prevention
The following are illustrative methodological formulations organised by reporting guideline items. They do not reproduce actual reviewer comments or represent any particular journal or reviewer.
On immortal time bias
Illustrative comment · Not an actual reviewer comment
The authors defined exposure from the date of first prescription, but the follow-up time appears to begin at cohort entry, which may predate the index date. This immortal time — during which the outcome cannot occur — inflates the time at risk in the exposed group and biases the hazard ratio toward a protective effect.
Prevention: state in Methods that the exposure start (index date) is the first time the exposure definition is met, and follow-up starts at the index date. Describe immortal time handling in a separate Methods paragraph. During data standardisation, use SQL/R code to check each patient's index date ≤ follow-up start. Timeline annotations in the Strengthening the Reporting of Observational Studies in Epidemiology (STROBE) participant flowchart (following the REporting of studies Conducted using Observational Routinely-collected health Data (RECORD) guidance for routinely collected data) should match the Methods text.
On PSM matching quality
Illustrative comment · Not an actual reviewer comment
After propensity score matching, the authors claim the two groups are comparable, but no standardized mean differences (SMD) are reported for individual covariates. It is unclear whether residual imbalance remains after matching, especially for key confounders such as disease severity.
Prevention: report each covariate's pre- and post-matching SMD in Table 1 and provide a supplementary Love plot. If a key covariate's post-matching SMD remains >0.1, explain the reason (such as a highly skewed distribution) and supplementary analyses in Methods. Provide IPTW sensitivity results in the supplement and refer to them in the main text as "consistent with primary PSM analysis".
On competing risks
Illustrative comment · Not an actual reviewer comment
The primary outcome is cardiovascular mortality. However, all-cause mortality is a competing event that was not accounted for. Standard Cox regression in this setting may overestimate the cumulative incidence of the primary outcome, particularly in older populations with high competing event rates.
Prevention: list all potential competing events (such as all-cause death and loss to follow-up after discharge) in the outcome definition and specify whether the primary analysis uses a competing risks model (Fine-Gray or cause-specific Cox). If using standard Cox, explain in the limitations that competing events were uncommon in this population, with supporting numbers, or add a competing risks model comparison as a sensitivity analysis.
05 Clinical Research
Deliverables
| Deliverables | Specifications and content |
|---|---|
| Data quality report | Missingness matrix by centre, ICD code mapping table and exposure window audit log. These can accompany the paper's Data Availability Statement. |
| DAG causal diagram (DAGitty source + high-resolution export) | Rationale for confounder selection with the minimally sufficient adjustment set annotated. Suitable as an online supplement for journals such as Epidemiology / IJE or for citation in Methods. |
| PSM matching script + Love plot | R matching code using MatchIt, with pre- and post-matching SMD tables and a Love plot. The Love plot can be submitted directly as supplementary Figure S1. |
| Cox regression code + figure package | Complete primary, subgroup and sensitivity analysis code (R/Stata/SAS), with Kaplan-Meier curves, subgroup forest plots and Schoenfeld residual plots in 300 DPI TIFF format. |
| STROBE reporting checklist | Item-by-item checks of all 22 items, with corresponding text locations and page numbers. Ready to submit as a reporting checklist supplement. |
06 Clinical Research
Engagement scope and guidance
Cross-centre exposure definitions and data standardisation
This is feasible, but data must be standardised before modelling; this is the first task in Collaboration starter. Deliverables include a harmonised variable dictionary and data quality report, with modelling starting only after written agreement from all parties. Where key variables have high missingness at some centres, the assessment will explain whether the extent and likely mechanism of missingness affect feasibility.
Statistical power after halving the sample
Assess this through power calculations before matching. If the expected post-matching event count cannot support Cox analysis (required events estimated using the Schoenfeld formula from the expected HR, significance level and power, rather than an events-per-variable (EPV) rule), consider IPTW to retain all participants while weighting for baseline balance, or explicitly report power limitations. Both options can be supported by methodological literature in Methods.
Multicentre data privacy
Clients must de-identify personal information before submission, removing direct identifiers such as names, identity numbers and hospital numbers. De-identified analysis data are transferred over HTTPS and stored in a compliant cloud environment in mainland China. Access is limited on a minimum-necessary basis and logged. Intermediate data are deleted after the project within the contractual timeframe.
Additional analyses and revision scope
Full-service management and Multicentre / RCT include up to 3 in-scope revisions addressing reviewers' statistical questions, without additional fees. The scope covers model parameter adjustments, variants of prespecified sensitivity analyses and supplementary figures and tables. Unplanned new analyses, such as reviewer-requested external validation in a sub-database outside the original design, require a separate quotation. Collaboration starter does not include revision coverage.
Related services
Study design
Support before data collection: prespecified DAG, refined Population, Intervention, Comparator and Outcome (PICO), sample size calculation report and draft STROBE checklist.
Writing and revision
Methods section standardisation + STROBE self-check + cover letter preparation + point-by-point reviewer responses.
Statistical analysis
PSM / Cox / restricted cubic splines (RCS) / competing risks, including sensitivity analyses and independent recalculation by quality control according to package tier; code included with delivery.
Get started · Methodology assessment
Book a methodology assessment
Submit your research question, available data and intended outputs. Reply within 24 hours (business days first), with feasibility feedback, viable statistical approaches and a recommended package in our first response.
Our involvement in a paper is disclosed truthfully: where our staff meet the authorship criteria of the International Committee of Medical Journal Editors (ICMJE), they are listed as authors under our company's real affiliation; any other contribution is stated in the acknowledgements. Acceptance is decided by the journal editorial office and peer review. We do not promise publication outcomes.