Clinical Research Services

Statistical analysis

Statistical modelling addresses the research question, with analysis code, result figures and tables, English Methods text and key decision records delivered.

Clinicians and researchersData already cleanedCox regressionMeta-analysis

01Clinical Research Services

Statistical deliverables and scope

Analysis code (data cleaning, modelling and plotting scripts)

Includes data cleaning, modelling and plotting scripts with Chinese comments, allowing a complete reproducible run. The data dictionary defines each variable, its range, coding and source (such as the corresponding CRF field), and can serve as a methodological supplement for journal submission. SPSS, Stata or SAS formats can also be provided as agreed in the contract.
English Methods text

Covers data sources, inclusion and exclusion criteria, variable definitions and measurements, statistical method rationale, triggers for sensitivity analyses and missing data strategies. All software names and versions are listed (for example, “R version 4.3.2, using the 'survival' package v3.5”), with language edited to the target journal's style (BMJ, JAMA or a specialist journal).

Key decision records (decision log)

Each key modelling decision (model type, final covariate list and triggers for sensitivity analyses) is recorded in writing in the project management system (PMS), with a timestamp and decision-maker. These records support responses to reviewers asking about model selection and can inform subsequent revisions and submissions.

Main analysis model and milestone confirmation records

Before the main analysis, confirmation of the model type and core covariates is requested from the client through the PMS, including choices between Cox and competing risk models, and between PSM and inverse probability of treatment weighting (IPTW). The project lead proceeds only after the client's asynchronous confirmation. Later changes to the main model or core covariates also require client confirmation, with written records retained.

Figure source files

Each stage ends with its corresponding deliverables, including study protocol documents, analysis code, figure source files or draft responses to reviewers.

02Clinical Research Services

Specifications, timelines and pricing

Statistical analysis

When it applies

Clinicians and researchers

Cleaned data requiring a single model, such as propensity score matching (PSM), Cox regression or meta-analysis

Deliverables

Analysis code (data cleaning, modelling and plotting scripts), data dictionary (standardised variable dictionary), publication-quality result figures and tables, English Methods text, result tables, key decision records (decision log), figure source files, main analysis regression tables, sensitivity analysis summary tables, and main analysis model and milestone confirmation records

Specifications and timelines

Turnaround for standalone services is confirmed during assessment.

Collaboration starter from ¥12,800, Full-service management from ¥25,800, and custom quotes for Multicentre / RCT. Target timelines are 4–8 weeks, 12–16 weeks and 6–12 months, respectively, from receipt of complete data.

Pricing basis

A single statistical analysis starts from ¥6,800 for cleaned data requiring one model only.

View all standalone prices

Deliverables depend on the selected services and package. Sensitivity analyses and independent reruns by a QC reviewer are included in Full-service management and higher packages; for Collaboration starter, the project lead performs a pre-delivery self-check.

03Clinical Research Services

Publication-quality result figures and tables, result tables, main analysis regression tables and sensitivity analysis summary tables

Method descriptions explain the analytical approach; Illustrative data in figures do not represent actual patients or commissioned projects.

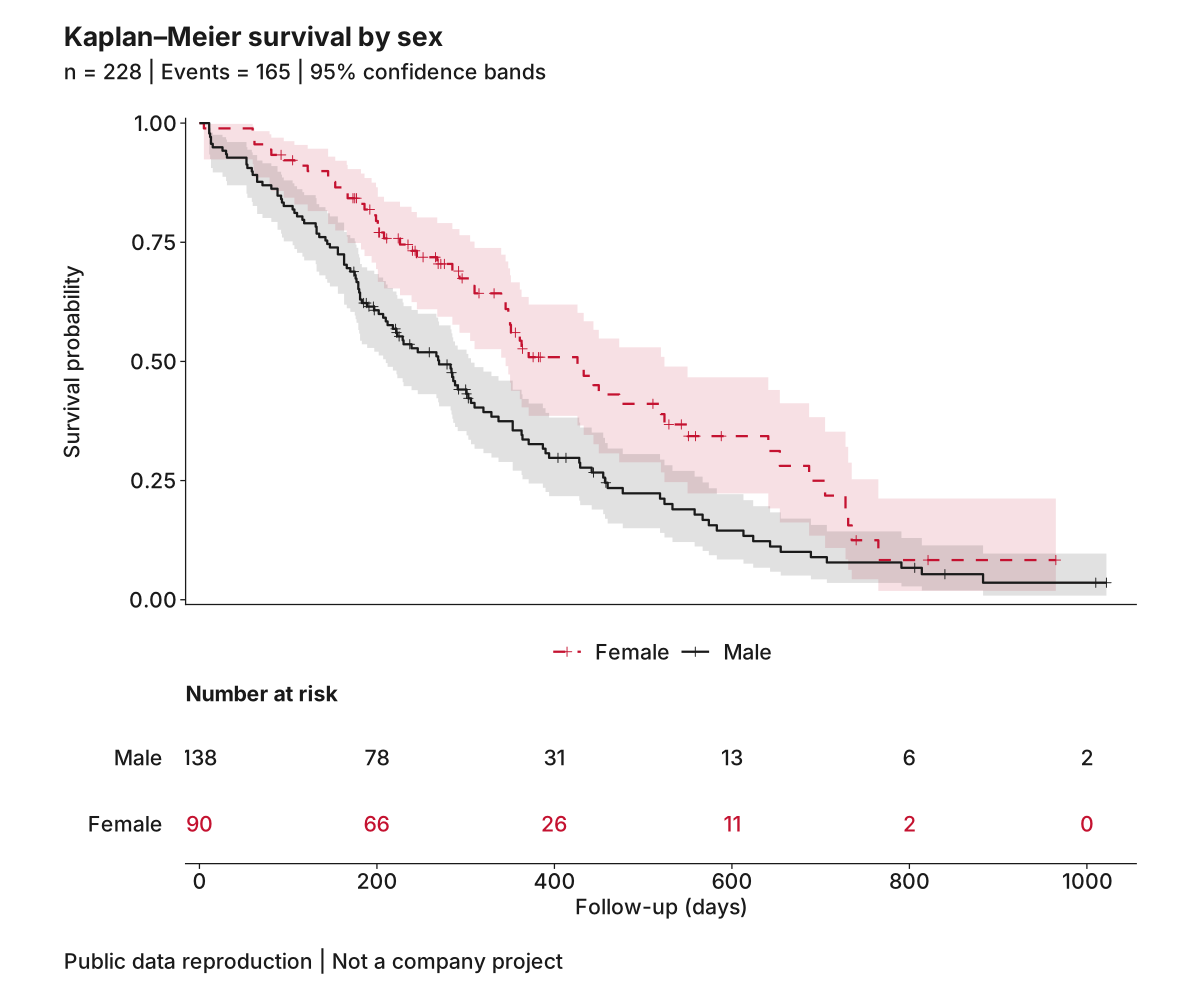
Kaplan–Meier survival curves and numbers at risk
Figure 1Kaplan–Meier survival curves and numbers at riskReproduction of public data · Not a Yanto Health project
Figure caption

Reproduced from public data. Of 228 participants, 138 were male and 90 female, with 165 deaths. Survival curves are estimated by sex; shading shows 95% confidence intervals and ticks indicate censoring. Numbers at risk count participants still under follow-up without an event immediately before each time point.

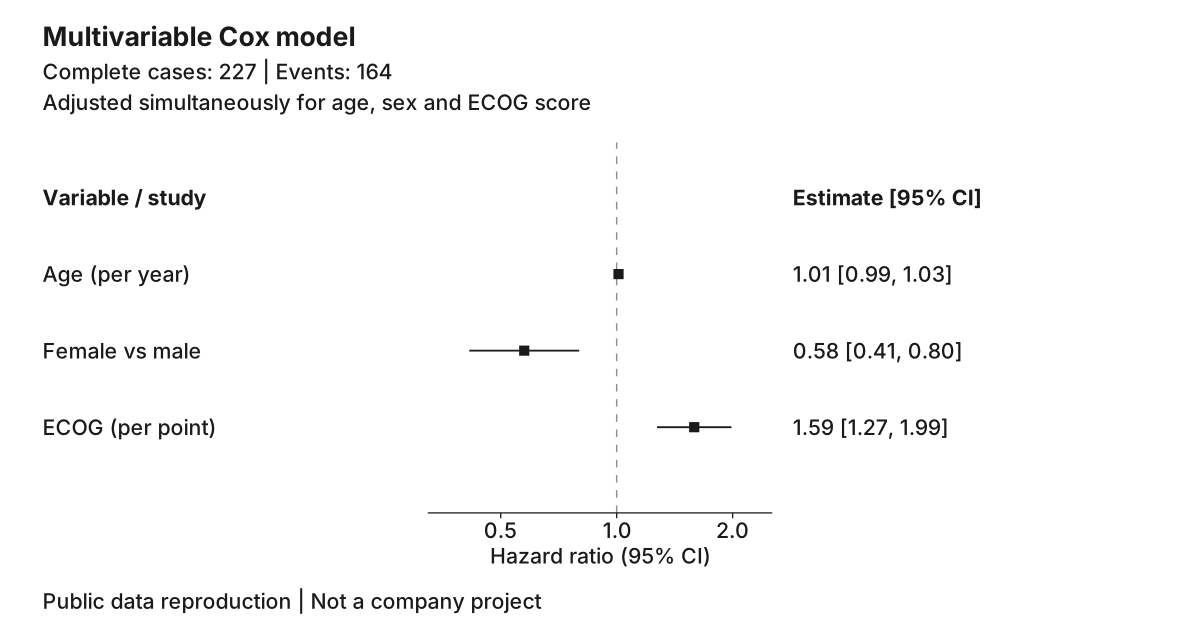
Multivariable Cox regression forest plot
Figure 2Multivariable Cox regression forest plotReproduction of public data · Not a Yanto Health project
Figure caption

Reproduced from public data. There are 227 complete cases and 164 deaths; age, sex and ECOG score are included together in the model. The adjusted hazard ratio (HR) for females versus males is 0.58 (95% confidence interval 0.41–0.80). Age is modelled per year and ECOG score per point. Results are associations; proportional hazards diagnostics are stored separately with the analysis data.

04Clinical Research Services

Standalone pricing

Standalone pricing
ItemPriceEligibility
Single statistical analysisfrom ¥6,800Cleaned data requiring one model only, such as PSM, Cox regression or meta-analysis
Single figure redrawing¥800–¥1,500 per figureExisting analysis results requiring publication-quality ggplot2 vector graphics
Independent statistician reviewfrom ¥6,800 per projectAnalysis completed externally, requiring an independent rerun by a second statistician
Multicentre database designfrom ¥18,800Case report form (CRF) design, database development and data dictionary
Package timelines and expedited work

The contractual target timeline for Collaboration starter is 4–8 weeks from receipt of complete data. It includes basic data cleaning, the main analysis with the core model and a pre-delivery self-check by the project lead, but excludes an independent QC rerun; MICE is included in Full-service management. Full-service management has a contractual target timeline of 12–16 weeks from receipt of complete data, covering study design, in-depth cleaning and MICE, statistical modelling with sensitivity analyses, full manuscript editing and an independent QC rerun. Multicentre / RCT has a contractual target timeline of 6–12 months from receipt of complete data. Radiomics projects require an additional 2–4 weeks depending on feature count and data scale. These are standard timelines; urgent deadlines, such as annual meeting abstract deadlines, can be raised at the first discussion for a feasibility assessment and expedited plan.

05Clinical Research Services

Analysis process and scope

R / SPSS / Stata / SAS scripts are delivered as agreed in the contract.

Data cleaning and exploratory analysis

Outliers are detected using the interquartile range (IQR) rule (< Q1 − 1.5×IQR or > Q3 + 1.5×IQR), the 3σ rule or Grubbs' test. Missing data analysis describes each variable's missingness proportion and pattern. Little's test can assess the MCAR assumption, but MAR and MNAR cannot be tested from observed data; assumptions must draw on the study context, with sensitivity analyses assessing the impact of MNAR on conclusions. Distribution checks include normality tests for continuous variables (Shapiro–Wilk or Kolmogorov–Smirnov), frequency tables for categorical variables, and density and quantile–quantile (Q-Q) plots for continuous variables. Categorical variables are checked for consistent coding, such as yes/no codes across centres; continuous variables are checked for physically implausible values, such as age <0 or >120, or body mass index (BMI) <10 or >80. Deliverables include a data cleaning log with the rationale for each decision, a missingness heatmap and a draft baseline descriptive Table 1.

Data standardisation and exposure definition

When combining multicentre data, each centre is checked for differences in International Classification of Diseases (ICD) coding versions, drug exposure windows and endpoint definitions. The exposure start (index date) must precede the start of follow-up to avoid immortal time bias. Deliverables include a standardised variable dictionary and data quality review report.

Main analysis modelling (strictly following the SAP)

The main analysis follows the confirmed SAP. Cox proportional hazards models assess the PH assumption using Schoenfeld residual tests and plots; if it fails, time-dependent covariate or stratified Cox models are used. PSM includes propensity score estimation by logistic regression, 1:1 or 1:N nearest-neighbour matching (caliper 0.2 times the standard deviation of the propensity score logit, Austin 2011), and verification that post-matching SMD<0.1. IPTW with stabilised weights (SW) and truncation of extreme weights is an option. RCS analyses report nonlinearity P values (Wald test) and overall P values; knot counts follow Harrell's recommendations, usually 3–5 depending on sample size, placed at quantiles, with exposure–response curves plotted. All interactions are prespecified in the SAP, with no post hoc multiple comparisons. Subgroup analyses report interaction P values rather than separate hypothesis tests within each subgroup.

Sensitivity and subgroup analyses

Included in Full-service management and higher packages; Collaboration starter focuses on the main analysis with the core model. At least 3 sensitivity analysis types are prespecified in the SAP. Common types include: ①redefining exposure, such as changing the exposure period start; ②using different follow-up windows, such as extending or shortening follow-up; ③comparing complete and imputed datasets; ④extreme-assumption sensitivity analyses (E-values: the strength of unmeasured confounding needed to render an effect estimate uninformative); ⑤positive control analyses using a known effective intervention to validate the methodological framework. Subgroup stratification variables are prespecified in the SAP. Forest plots show subgroup HRs or odds ratios (OR) and 95% confidence intervals, with between-subgroup interaction P values rather than separate subgroup P values, to avoid overstating results through multiple comparisons. Interaction P values are reported in forest plot captions.

Managing multicentre data heterogeneity

Managing multicentre data heterogeneity

Database development

CRF design, database development and data dictionary

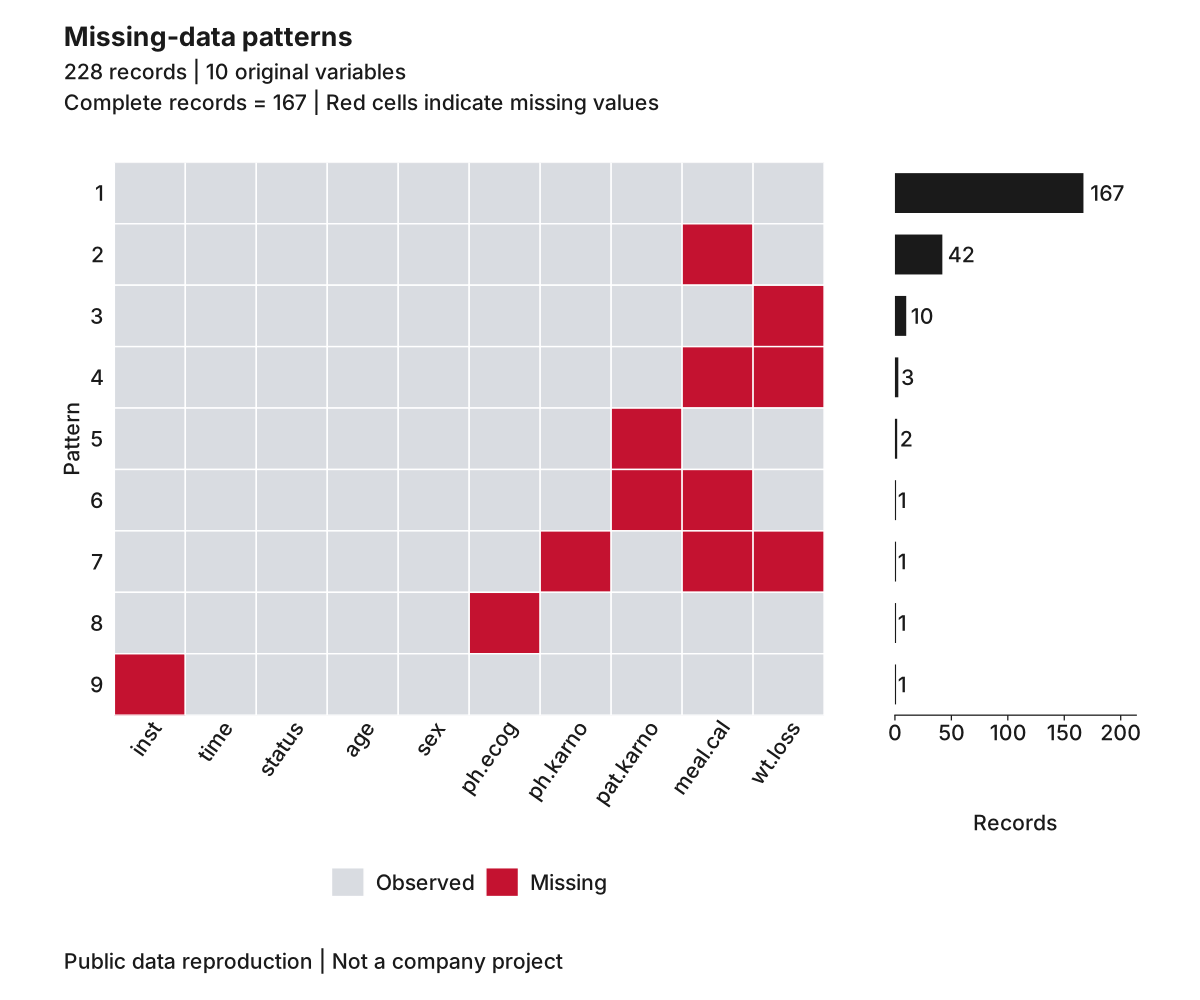
Missing data pattern plot
Figure 3Missing data pattern plotReproduction of public data · Not a Yanto Health project
Figure caption

Reproduced from public data. There are 228 records, 10 original variables and 9 missingness patterns, with 167 complete records; meal.cal is missing in 47 records. Red indicates missing and grey indicates observed values. The plot describes missingness distribution and does not infer its mechanism.

06Clinical Research Services

Pre-delivery verification and resources

Packages and pre-delivery verification
PackagesPre-delivery verification
Collaboration starterNo independent QC rerun; the project lead performs a pre-delivery self-check.
Full-service managementIncludes an independent QC rerun (a second person reruns the main analysis)
Multicentre / RCTAdds independent statistician review to Full-service management
Independent QC rerun and code packaging

After the project lead completes modelling, an independent QC reviewer performs all core analyses from raw data, independently loading data, writing cleaning and modelling scripts, and producing figures and regression tables. This applies to Full-service management and Multicentre / RCT. Until the rerun is complete, the reviewer does not see the project lead's code, intermediate files or results, working only from raw data and the confirmed statistical analysis plan (SAP). The two sets of results are compared metric by metric, with an absolute difference tolerance of 0.001. Differences greater than 0.001 must be traced to data processing or model implementation, reconciled and resolved in the final conclusions.

Anonymised modelling workflow for comparable studies

A complete analysis plan for the client's dataset is issued after the free assessment discussion, because method selection depends on each study's data structure. A generic example cannot replace a tailored analysis plan.

Annotated R, SPSS and Stata analysis snippets, provided with statistical analysis services.

Get started · Methodology assessment

Book a methodology assessment

After clients submit their research question, available data and intended outputs, our first response provides methodological feasibility feedback and a recommended package. Reply within 24 hours (business days first), measured in Beijing time; for requests submitted on non-business days, the clock starts at 09:00 on the next business day.

Request an assessmentFree assessment · Quote after assessment