
Clinical Research Services
Radiomics diagnostic model
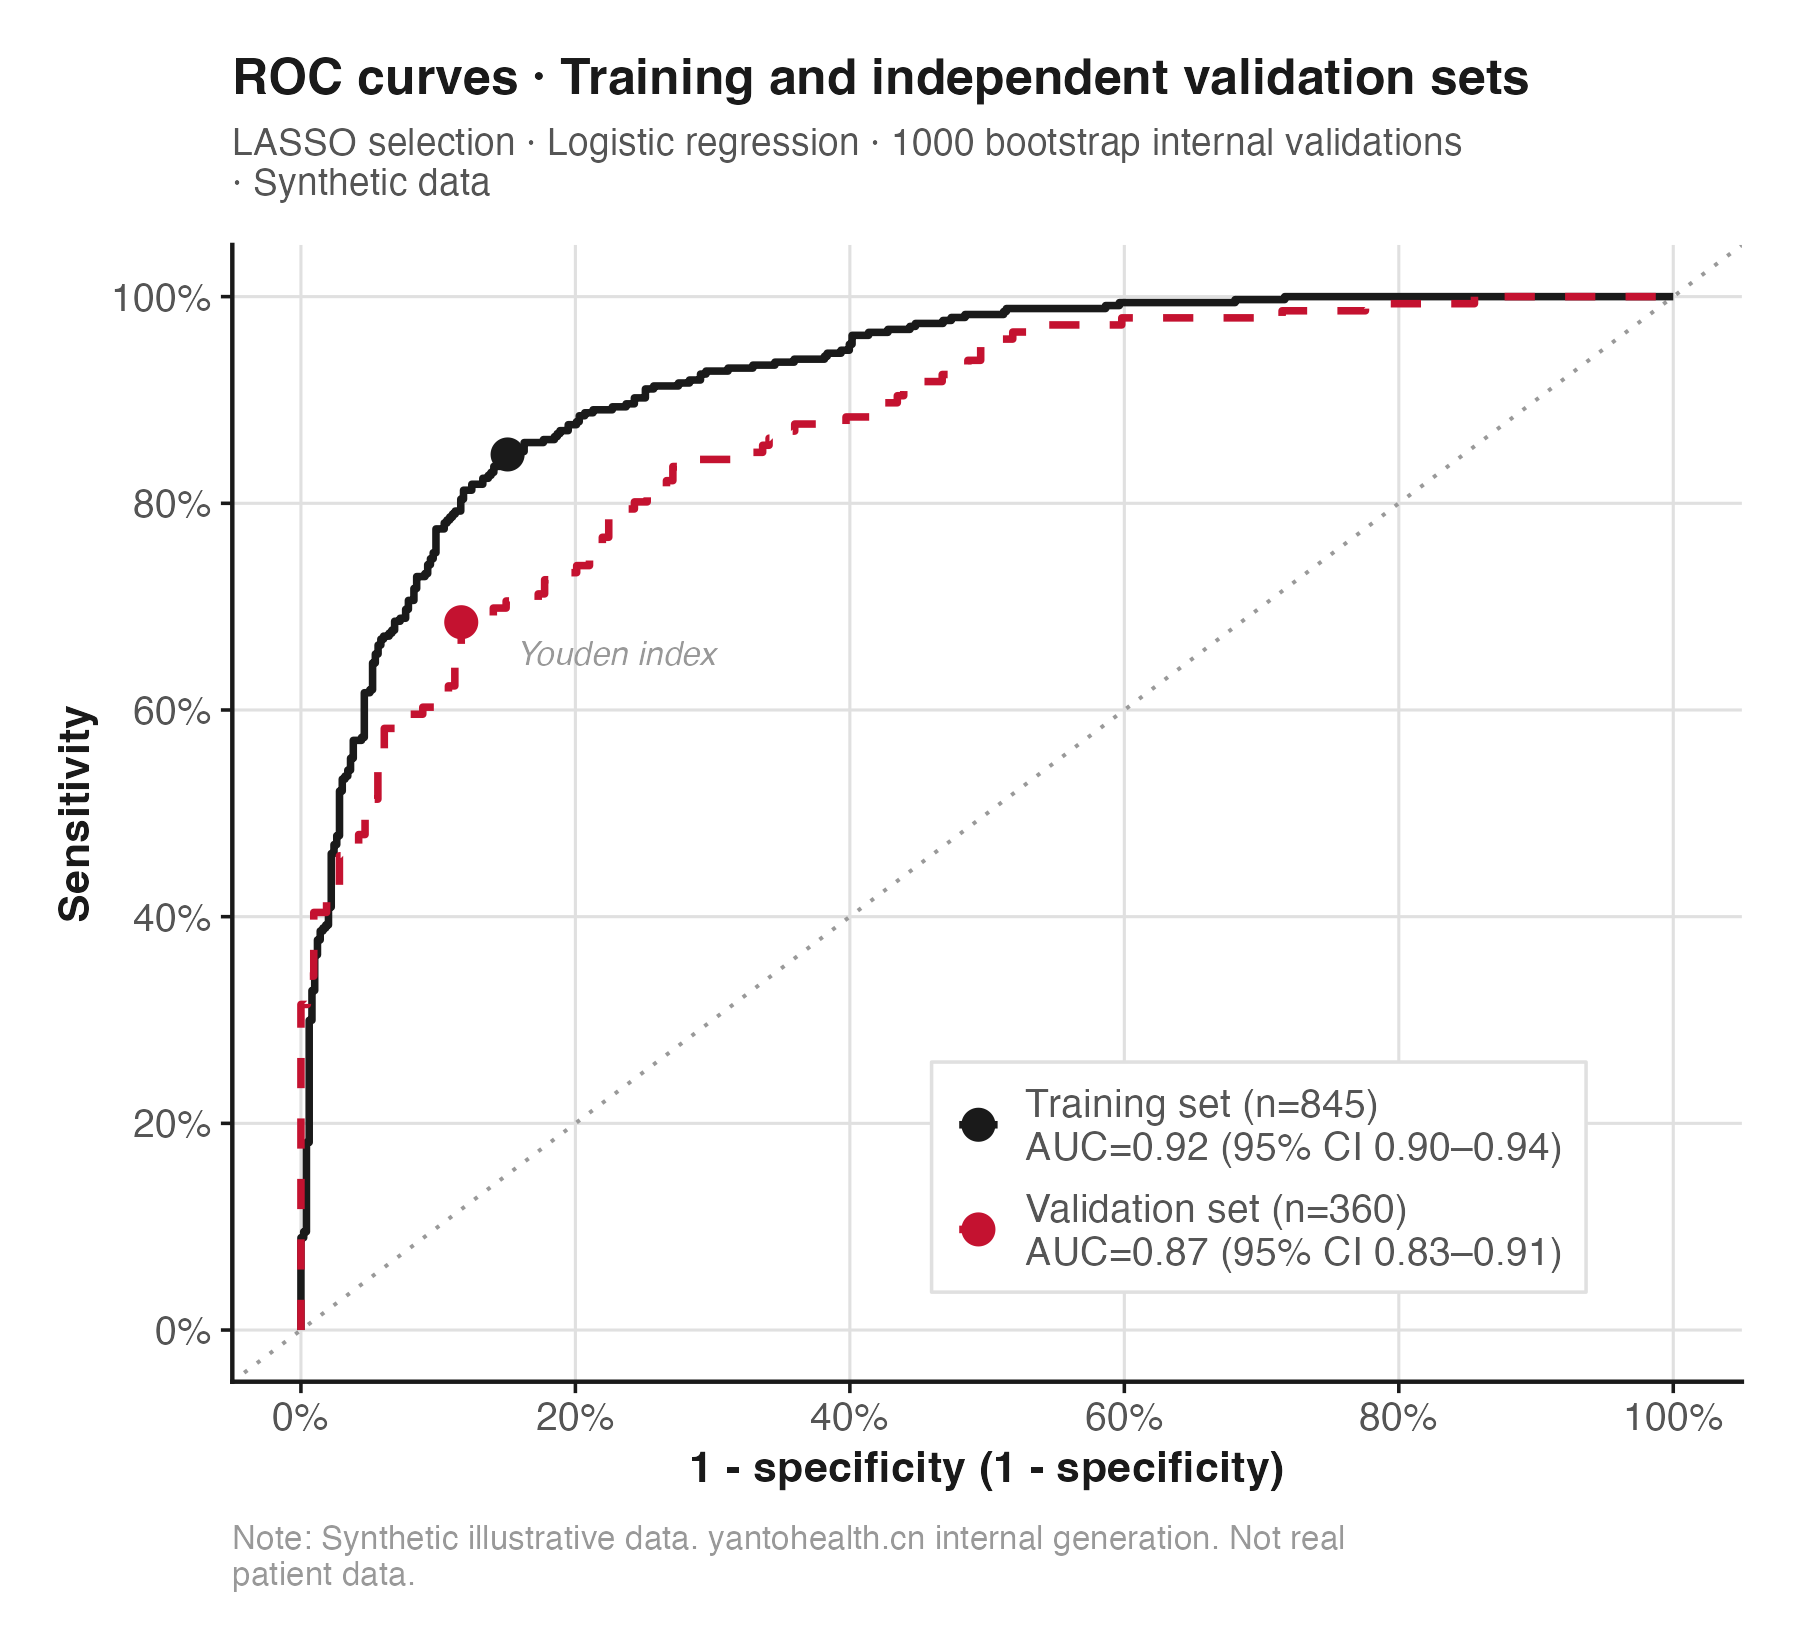
An area under the curve (AUC) of 0.87 is only the starting point for evaluation. Reviewer questions usually focus on independent external validation, data leakage during feature selection, and whether decision curve analysis supports practical clinical value.
All data and figures on this page are Illustrative data and do not represent actual patients, hospitals or client projects.
- Training + independent external validation sets
- 845 + 360
- Training / external validation AUC
- 0.92 / 0.87
- Bootstrap internal validation
- 1000 resamples
- Decision curve analysis (DCA): greater net benefit across scanned thresholds
- 5%–80%
01 Clinical Research
Methodological figures
Illustrative data show analytical approaches and presentation only; they do not represent actual project results.
Illustrative data. All figures and numbers on this page are Illustrative data (synthetic), generated by Yanto Health using R simulation scripts. They do not represent any actual patients, hospitals or client projects. Generation scripts are available on request.
Caption and interpretation limits
Apparent training AUC=0.92 (n=845, without optimism correction); external validation AUC=0.87 (n=360). The paired curves illustrate discrimination differences between training and external validation sets (Illustrative data); DeLong 95% CIs are also shown.
Caption and interpretation limits
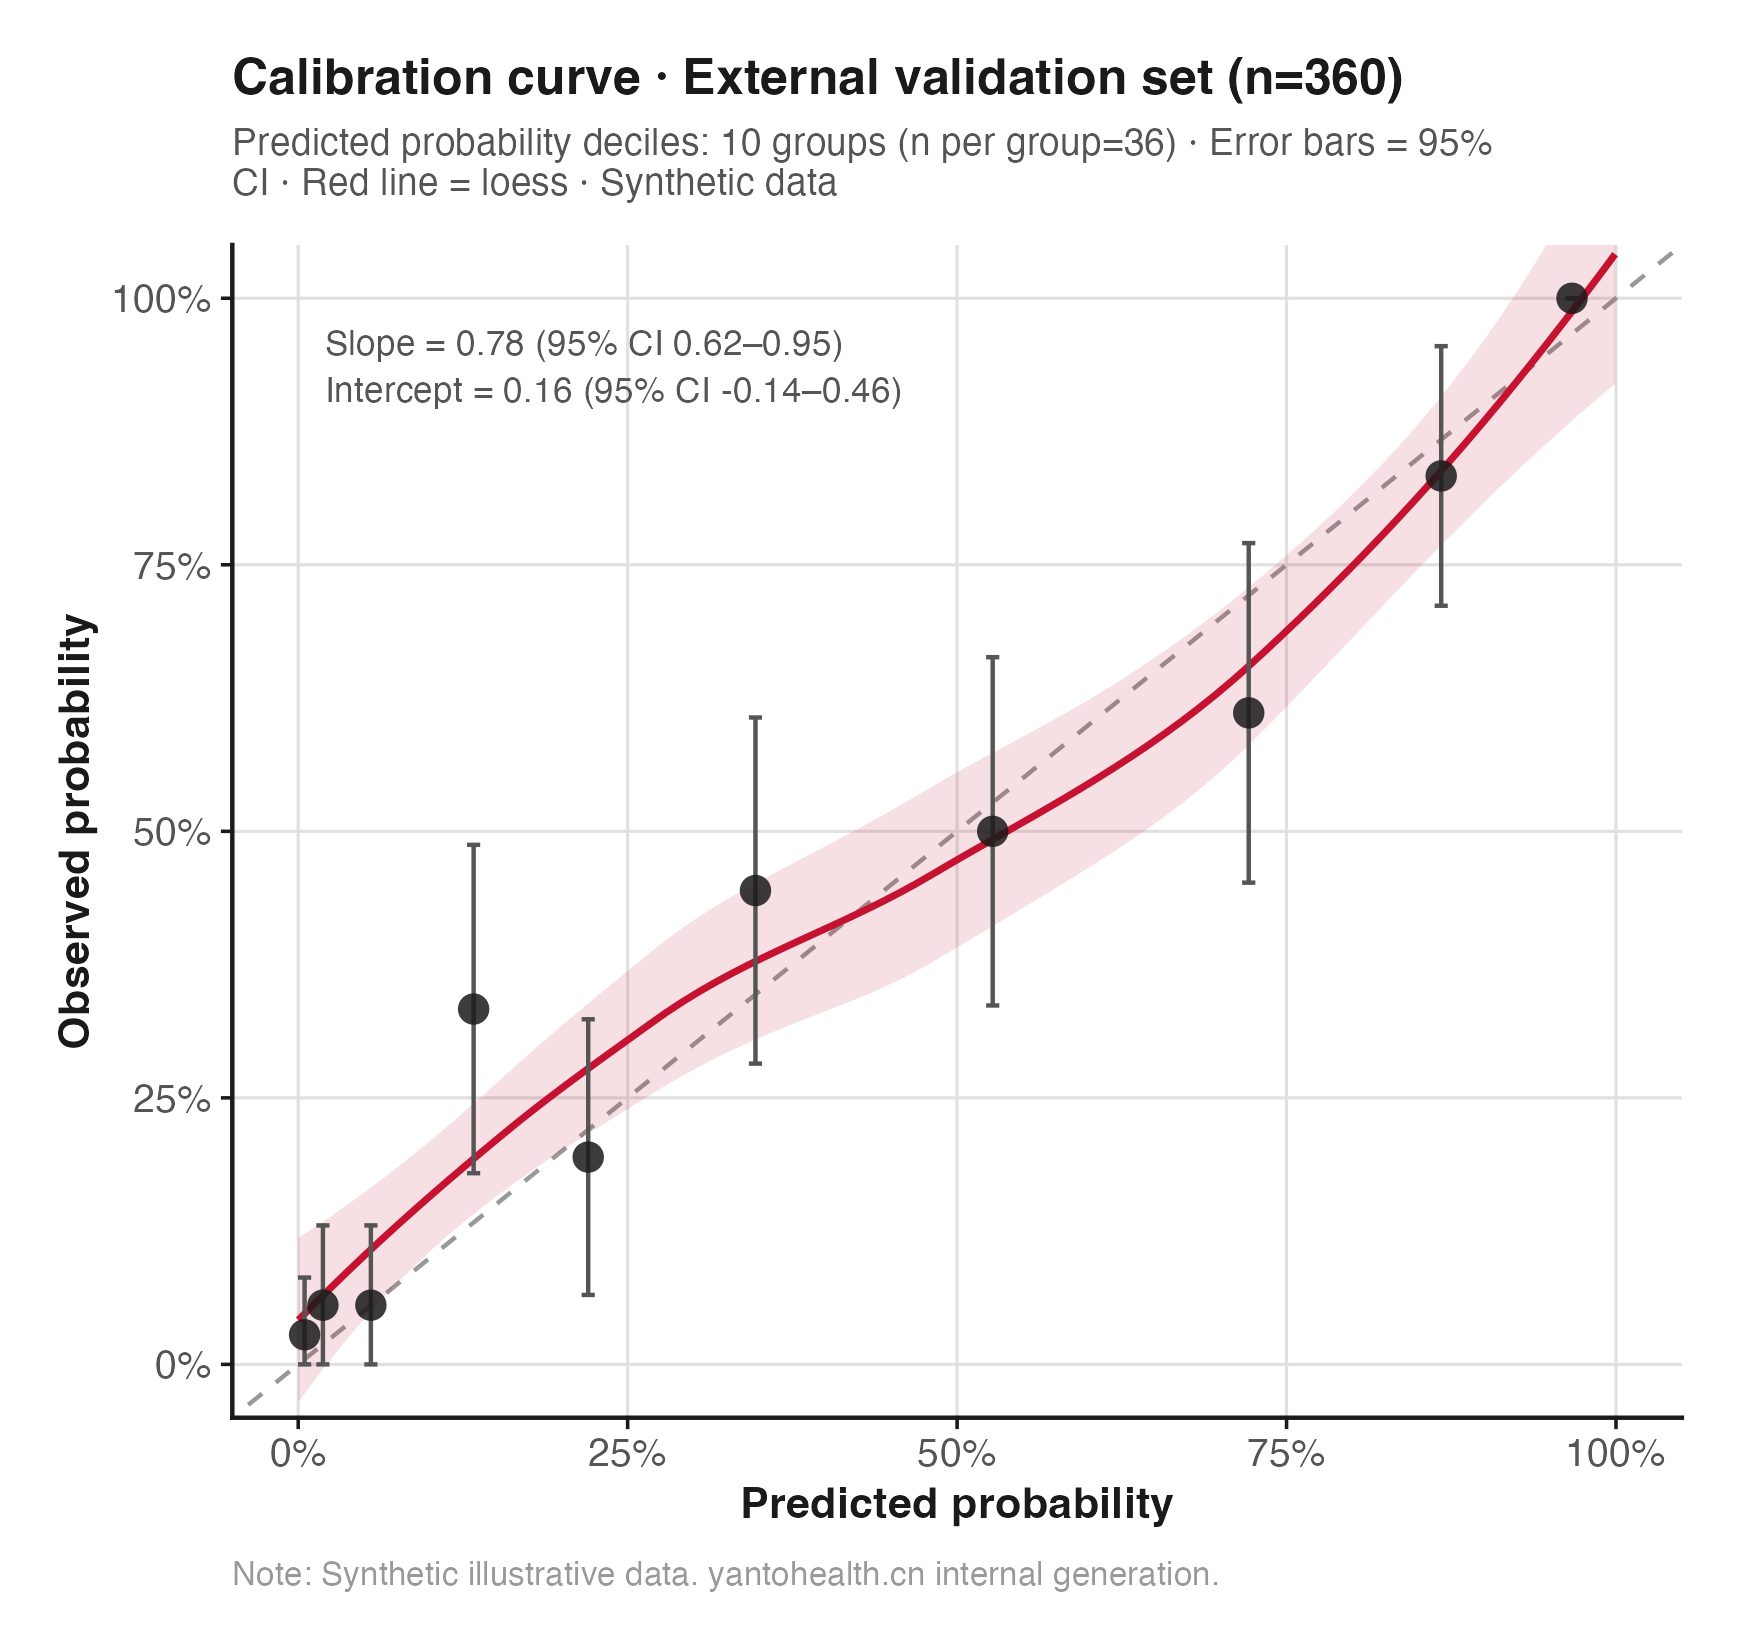
Predicted probabilities are divided into 10 decile groups (n=36 each). Error bars show 95% CIs for observed rates; the red line is a loess smoother and the diagonal is ideal calibration. The figure reports a calibration slope of 0.78 (95% CI 0.62–0.95) and intercept of 0.16 (95% CI -0.14–0.46), calculated from Illustrative data. A slope below 1 suggests overly extreme predictions. Calibration is assessed using curves, slope and intercept (Transparent Reporting of a multivariable prediction model for Individual Prognosis Or Diagnosis, including Artificial Intelligence (TRIPOD+AI); Van Calster et al., 2019), rather than primarily relying on the Hosmer-Lemeshow test.
Caption and interpretation limits
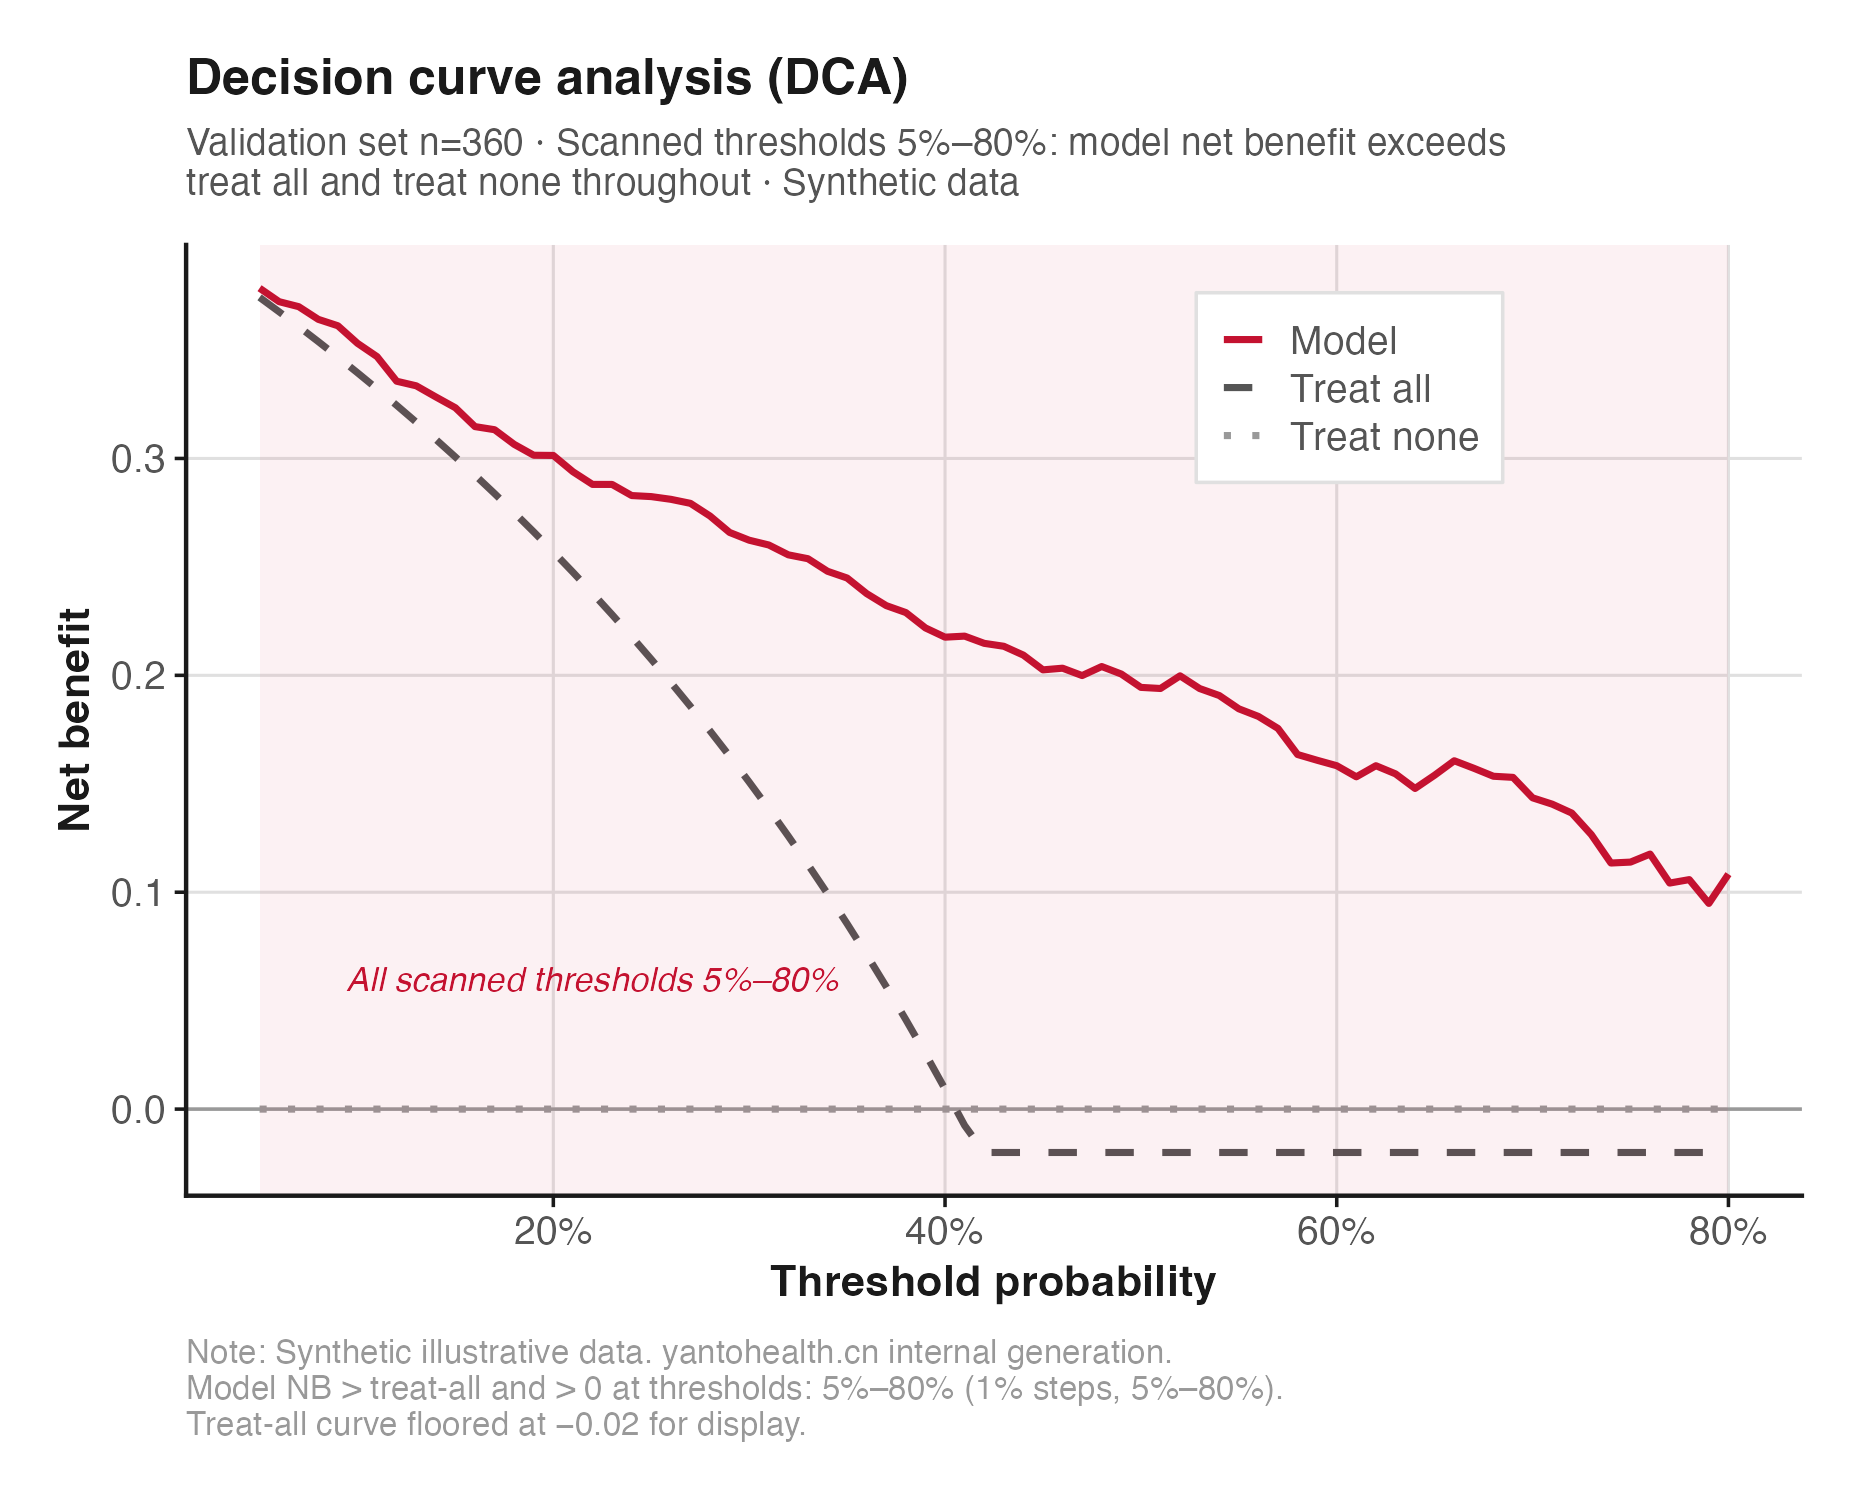
Across scanned decision thresholds of 5%–80%, the model has greater net benefit than both treat-all and treat-none strategies. Pale red shading marks the scanned range. Thresholds for actual use should be prespecified using clinical consensus.
02 Clinical Research
Methodological risks
Radiomics diagnostic studies face three systemic methodological risks. First, many more features than participants (the "curse of dimensionality"): modelling without dimensionality reduction causes severe overfitting, with high training AUC and substantially poorer validation performance. Second, data leakage from validation data entering feature selection inflates performance. Third, clinical utility remains unsubstantiated when AUC is reported without DCA, prompting questions about practical clinical use.
Choose reporting guidance by study purpose: Standards for Reporting Diagnostic Accuracy Studies (STARD) 2015 applies to accuracy studies of individual tests or markers; TRIPOD+AI (2024) applies to developing or validating multivariable diagnostic/prognostic models, whether regression or machine learning is used, and replaces TRIPOD 2015. This multivariable radiomics diagnostic example follows TRIPOD+AI. Reviewers scrutinise reporting compliance, including whether candidate predictors were prespecified, feature selection stayed within training data, and missingness was handled before or after splitting. Explain each in Methods.
Methodological priorities: strict training/validation separation → feature selection within training data → least absolute shrinkage and selection operator (LASSO) / recursive feature elimination → 1000 bootstrap resamples for internal validation + independent external validation → clinical value through DCA → item-by-item TRIPOD+AI checks.
- Validation data used in feature selection (data leakage)
- No independent external validation
- AUC reported without DCA clinical utility analysis
- Feature stability (intraclass correlation coefficient (ICC)) not reported
- Sample size not justified using prediction-model sample size methods (Riley et al., 2019/2020)
- Calibration judged only by Hosmer-Lemeshow, without curves, slope or intercept
03 Clinical Research
Analytical framework
Feature stability screening (ICC)
After radiomics feature extraction, assess intra-observer and inter-observer agreement using ICC. Features with ICC<0.75 are considered unstable and removed before modelling. This is candidate-predictor preprocessing and prescreening without outcome information. TRIPOD+AI requires reporting the methods, thresholds and exclusions in Methods.
Strict training/validation separation (splitting before processing)
Split data before any feature selection or preprocessing. This example uses 845 training participants from the development institution and 360 external validation participants from another institution. A random split such as 7:3 within a single data source is internal validation and must not be labelled external; time-based validation must also be labelled accurately under TRIPOD+AI. Keep training and validation data fully separate. Fit imputation and standardisation (Z-score or Min-Max) on training data, then apply the parameters to validation data. No validation information may enter training.
Feature selection within the training set
Use two-stage selection within training data: correlation screening (remove highly correlated feature pairs with Pearson r>0.9) + regularised dimensionality reduction (LASSO logistic regression, choosing optimal λ by 10-fold cross-validation). Determine the supported number of candidate predictor parameters using Riley et al.'s (2019/2020) prediction-model sample size method (pmsampsize), with LASSO shrinkage to control overfitting. Events-per-variable (EPV) rules cannot replace this calculation. Submit the LASSO path plot as a supplementary figure.
Model development and internal validation (1000 bootstrap resamples)
Build a logistic regression model using LASSO-selected features, with random forest / support vector machine (SVM) comparisons where applicable. Use 1000 bootstrap resamples for optimism correction and report the difference between original and corrected AUC to quantify overfitting. Assess calibration with a calibration plot, slope and intercept; the Hosmer-Lemeshow test alone is insufficient.
Independent external validation
Evaluate performance on a fully independent external dataset from another institution or time period: AUC + 95% CI (DeLong), sensitivity, specificity, and positive/negative predictive values. If discrimination or calibration falls substantially below optimism-corrected development performance, discuss possible reasons such as data sources, scanners and population distributions.
DCA decision curves + nomogram
Decision curve analysis (DCA) compares net benefit for the model, treat-all and treat-none across probability thresholds to evaluate clinical utility. Visualise the model as a nomogram or scoring system for clinical use. Include an item-by-item TRIPOD+AI checklist with delivery.
04 Clinical Research
Reviewer questions and prevention
The following are illustrative methodological formulations organised by reporting guideline items. They do not reproduce actual reviewer comments or represent any particular journal or reviewer.
On data leakage and overfitting
Illustrative comment · Not an actual reviewer comment
The authors report an impressive AUC of 0.94 in the training cohort, which drops to 0.79 in the test cohort. This discrepancy suggests significant overfitting. Furthermore, it is unclear whether feature selection was performed on the entire dataset before splitting, which would constitute data leakage and invalidate the validation performance.
Prevention: explicitly state in Methods that splitting preceded any feature selection or preprocessing. Keep all selection, including LASSO cross-validation tuning, within training data. Fit all preprocessing parameters (means/standard deviations) on training data and apply them to validation data. Report optimism correction from 1000 bootstrap resamples in Methods or tables to quantify overfitting.
On missing external validation
Illustrative comment · Not an actual reviewer comment
The model was developed and validated on patients from a single institution. Without external validation on an independent cohort from a different institution or time period, the generalizability of this model cannot be established. Internal validation alone is insufficient to support clinical adoption.
Prevention: the standardised validation pathway for radiomics diagnostic studies combines internal bootstrap validation with an independent external set from another institution or time period. If external data are unavailable, state this limitation and propose a planned multicentre validation study. Different periods from one institution can support a non-random temporal split; label this accurately as temporal validation. Its evidence for generalisability is weaker than between-institution geographical external validation, and the validation type must be stated truthfully.
On clinical utility
Illustrative comment · Not an actual reviewer comment
The authors report diagnostic performance metrics (AUC, sensitivity, specificity), but do not demonstrate the clinical utility of the proposed model. Without decision curve analysis comparing net benefit to current clinical alternatives, it is impossible to determine whether this model would actually improve patient management.
Prevention: DCA is now a routine figure in prediction/diagnostic model studies; we recommend including it alongside ROC curves in the main text rather than the supplement. Compare the model, treat-all and treat-none lines. Where consensus literature supports clinical thresholds, cite their source and focus conclusions on positive net benefit within the X%–Y% clinical threshold range.
05 Clinical Research
Deliverables
| Deliverables | Specifications and content |
|---|---|
| ICC feature stability report | Intra-/inter-observer ICC matrices, with exclusions for ICC<0.75 and reasons for removal. |
| LASSO feature selection code + path plot | R code using glmnet, including λ selection through 10-fold cross-validation (CV). LASSO coefficient paths and CV error curves can be submitted as supplementary Figures S1-S2. |
| ROC + calibration + DCA figure package | Training versus validation ROC curves with DeLong 95% CIs, calibration plots and DCA curves, in 300 DPI TIFF format. |
| Nomogram / scoring system visualisation | Nomogram from rms, with predictor point scales and total-score-to-probability mapping, ready as a main-text figure or clinical decision aid. |
| TRIPOD+AI reporting checklist | Item-by-item TRIPOD+AI checks with corresponding text locations, ready to submit as a reporting checklist supplement. |
06 Clinical Research
Engagement scope and guidance
Single-centre data and validation types
This is feasible, but must be clearly stated in Methods and the limitations, with internal validation covering all modelling steps (such as 1000 bootstrap resamples with optimism correction, repeating feature selection in every resample). If sample size permits, use earlier patients for development and later patients for temporal validation. Label a non-random time split as temporal validation; it provides weaker generalisability evidence than between-institution external validation. Journal requirements vary substantially: check each journal's author instructions and similar articles from the past two years before submission. If no external validation set exists, explain this fully in the limitations.
Handling more than 2000 imaging features
This is a typical curse-of-dimensionality problem. The standard process is ICC screening for instability → correlation screening for redundancy (Pearson r above 0.9) → final LASSO selection, with feature count determined by the cross-validated penalty rather than a fixed cap. All screening stays within training data. Estimate sample size and supported candidate predictor parameters using Riley et al.'s (2019/2020) prediction-model method, such as pmsampsize, rather than EPV rules. Where radiomics features greatly exceed the parameters supported by the sample, use penalised regression such as LASSO for shrinkage and selection, repeating every selection step in each bootstrap resample.
Multiple-model comparisons and selection bias
Prespecify model comparisons and the final selection rule in the analysis plan. A nomogram visualises a regression model such as logistic regression; it is not a separate competing model. Choosing the best performer after comparing models on the same data introduces selection optimism. Describe selection and include it in internal validation, for example by repeating it in each bootstrap resample. Provide other model results in supplementary tables. Focus the main text on complete validation of the final model (discrimination/calibration/DCA), rather than performance rankings.
Related services
Statistical analysis
LASSO / random forest / SVM / deep learning interfaces, with bootstrap internal validation + DCA + nomogram; code included.
Writing and revision
Item-by-item TRIPOD+AI self-check + Methods section standardisation + structured point-by-point responses to overfitting/external validation concerns.
Study design
Prediction outcome definition + external validation data source planning + prespecified candidate features + draft TRIPOD+AI checklist.
Get started · Methodology assessment
Book a methodology assessment
Submit your research question, available data and intended outputs. Reply within 24 hours (business days first), with feasibility feedback, viable statistical approaches and a recommended package in our first response.
Our involvement in a paper is disclosed truthfully: where our staff meet the authorship criteria of the International Committee of Medical Journal Editors (ICMJE), they are listed as authors under our company's real affiliation; any other contribution is stated in the acknowledgements. Acceptance is decided by the journal editorial office and peer review. We do not promise publication outcomes.